mean_signature <- matrix(c(2, 1, 1, 1, 2, 6 / 5), nrow = 3)
colnames(mean_signature) <- c("ct1", "ct2")
rownames(mean_signature) <- paste0("gene_", 1:3)
Sigma_iso <- array(c(diag(3), diag(3)), dim = c(3, 3, 2))
bulk <- drop(mean_signature %*% c(0.5, 0.5))

hessian_interior <- hessian_loglik_unconstrained(
  p = c(1 / 5, 3 / 10),
  y = bulk,
  mean_signature_matrix = mean_signature,
  Sigma = Sigma_iso
)
round(hessian_interior, 4)
#>           [,1]      [,2]
#> [1,] -208.8794 -342.2303
#> [2,] -342.2303 -391.7123
c(
  determinant = det(hessian_interior),
  eigen(hessian_interior, symmetric = TRUE)$values
)
#>  determinant
#> -35300.95781     53.93367   -654.52539
1.2 Population-level DeCovarT inference: MLE properties, confidence intervals and a GLM formulation
2026-11-02
Source:vignettes/01-2-population-inference.qmd
DeCovarT estimates a composition \boldsymbol{p}\in\Delta^{J-1} by maximising the Gaussian-convolution log-likelihood
\ell_{\boldsymbol{y}\mid\boldsymbol{\zeta}}(\boldsymbol{p}) = -\tfrac{1}{2}\log\det\boldsymbol{\Sigma}(\boldsymbol{p}) -\tfrac{1}{2} (\boldsymbol{y}-\boldsymbol{\mu}\boldsymbol{p})^{\top} \boldsymbol{\Sigma}(\boldsymbol{p})^{-1} (\boldsymbol{y}-\boldsymbol{\mu}\boldsymbol{p}) +C, \qquad \boldsymbol{\Sigma}(\boldsymbol{p})=\sum_{j=1}^{J}p_j^{2}\boldsymbol{\Sigma}_j . \tag{1}
The model, its ILR parametrisation and the derivatives of Eq. 1 are in the population generative and optimisation vignette. The single-cell counterpart of this vignette, with the two technical scales profiled out, is the single-cell inference vignette. This vignette asks three questions.
- What is the estimator entitled to claim? The generative vignette fixes the parametrisation; Sec. 1 gives identifiability, existence, the failure of concavity and the finite-sample bias, and Sec. 2 the expected Fisher information that every Wald interval uses.
- How should uncertainty on the proportions be reported? Sec. 3 states the regularity conditions of the large-sample approximation, reads the local geometry of the log-likelihood, compares the Wald, likelihood-ratio and score tests and inverts them into intervals, maps intervals from the unconstrained coordinate \boldsymbol{\rho} to \boldsymbol{p}, and treats nuisance scales, higher-order corrections, the finite-sample devices (Firth penalisation, the sandwich) and what conformal calibration can and cannot certify. Sec. 4 covers likelihood ratios on the boundary and the bootstraps.
- Which model should be fitted to real data? Sec. 6 argues for modelling the conditional mean through a link rather than transforming the data, writes DeCovarT as a multivariate quasi-likelihood model, and ends with the recommended model for a single UMI reference and few bulk samples (Sec. 6.4).
Two facts frame everything below: the realised log-likelihood is not concave and its maximiser need not be unique, and every Wald-type interval is undefined on a simplex face. Their remedies are implemented in lrt_decovart(), confint_profile_decovart(), bootstrap_decovart() and reference_bootstrap_decovart().
Notation (shared by all vignettes; aligned with the article)
Gene g=1,\ldots,G; cell type j=1,\ldots,J (a second type is \ell); bulk sample i=1,\ldots,N; reference donor (replicate) r=1,\ldots,R; cell c, with C_j reference cells of type j. The index i is dropped inside a derivation and restored in the model statements.
Symbol Meaning y_{gi}, \boldsymbol{y}_{\cdot i} Bulk expression on a linear scale m_{ji}, n_i=\sum_jm_{ji} Cells of type j in bulk sample i, and their total \tilde{\boldsymbol{y}}_{\cdot i}=\boldsymbol{y}_{\cdot i}/n_i Bulk expression per cell \boldsymbol{p}_{\cdot i}\in\Delta^{J-1} Cell fractions, p_{ji}=m_{ji}/n_i \boldsymbol{\rho}_{i}\in\mathbb{R}^{J-1} Isometric log-ratio (ILR) coordinates of \boldsymbol{p}_{\cdot i}, \boldsymbol{p}_{\cdot i}=\operatorname{softmax}(\mathbf{V}\boldsymbol{\rho}_i) with a Helmert basis \mathbf{V} \boldsymbol{q}_{\cdot i} Transcript fractions, q_{ji}=p_{ji}S_j/\sum_\ell p_{\ell i}S_\ell \boldsymbol{\mu}_{\cdot j}, \boldsymbol{\Sigma}_j Mean and G\times G gene–gene covariance of a type-j population profile \boldsymbol{\Omega}_j=\boldsymbol{\Sigma}_j^{-1} Precision matrix of type j \boldsymbol{\Gamma}_g J\times J covariance across cell types for gene g ( bMIND,EPIC-unmix,Unico)\boldsymbol{x}_{\cdot j,i} Purified profile of type j in sample i x_{gc}, \boldsymbol{x}_{\cdot c}, s_c Raw UMI count of gene g in reference cell c, and the size factor of cell c \boldsymbol{\lambda}_{\cdot c}, \boldsymbol{z}_{\cdot c} Size-free expression of cell c; its latent log-expression in the Poisson log-normal (PLN) model \tilde{\boldsymbol{\mu}}_{\cdot j}=C_j^{-1}\sum_{c\in j}\boldsymbol{x}_{\cdot c}=S_j\boldsymbol{\theta}_{\cdot j} Per-cell mean of the raw UMI counts of the C_j reference cells of type j \boldsymbol{\theta}_{\cdot j}, S_j=\mathbf{1}^{\top}\tilde{\boldsymbol{\mu}}_{\cdot j} Relative abundance (\mathbf{1}^{\top}\boldsymbol{\theta}_{\cdot j}=1) and mean transcriptome size of a type-j cell \boldsymbol{\Sigma}_{W,j}, \boldsymbol{\Sigma}_{B,j} Within-donor cell-to-cell covariance of type j (one single-cell sample); between-donor covariance of type j (needs R\ge2 donors) \boldsymbol{S}_W(\boldsymbol{v})=\sum_jv_j\boldsymbol{\Sigma}_{W,j}, \boldsymbol{S}_B(\boldsymbol{v})=\sum_jv_j^2\boldsymbol{\Sigma}_{B,j} Linear and quadratic covariance mixtures with weights \boldsymbol{v} \boldsymbol{V}_j Empirical covariance of type j, computed from its reference profiles or cells \boldsymbol{R}_j Empirical correlation matrix of type j (bold; the scalar R is the number of donors) \boldsymbol{\Delta}_j=\operatorname{diag}(\boldsymbol{V}_j) Diagonal matrix of the empirical variances of type j \lambda Penalty of a regularised covariance or precision estimator \psi_g, \mathcal{D}_g Negative binomial dispersion of gene g; deviance of gene g in a count model \delta_{gj} Detection rate of gene g in type j (fraction of cells with a non-zero count) \varpi_{\ell\mid j}, \varpi_{j\ell}, \bar\varpi MixSim overlap: probability of misclassifying a draw of j into \ell, pairwise overlap \varpi_{j\ell}=\varpi_{\ell\mid j}+\varpi_{j\mid\ell}, and its average over pairs ( BarOmega)\boldsymbol{T}_{ji}=\sum_{c=1}^{m_{ji}}\boldsymbol{X}_{jic} Total expression contributed by type j to sample i a_i Sample-wide scale between the reference and the bulk library c_i=a_in_i, \phi_i=a_i^2n_i Mean scale and variance scale of the single-cell model b_g, \tilde b_g=b_g^{\mathrm{bulk}}/b_g^{\mathrm{ref}} Capture efficiency of gene g in one protocol, and the gene-wise platform ratio; \tilde{\boldsymbol{B}}=\operatorname{diag}(\tilde{\boldsymbol{b}}) \boldsymbol{D}_i Diagonal, heteroscedastic bulk measurement noise A tilde marks a quantity rescaled to a reference unit: per cell (\tilde{\boldsymbol{y}}, \tilde{\boldsymbol{\mu}}) or relative to the reference protocol (\tilde{\boldsymbol{b}}). \boldsymbol{\Sigma}_j couples genes within one cell type; \boldsymbol{\Gamma}_g couples cell types within one gene. A symbol absent from this table is defined in the vignette that uses it, with one meaning there.
Theoretical properties of the DeCovarT MLE
Identifiability
Proposition 1 (Identifiability of the composition)
The parameter-to-distribution map is
\boldsymbol{p} \longmapsto \bigl( \boldsymbol{\mu}\boldsymbol{p},\; \boldsymbol{\Sigma}(\boldsymbol{p}) =\textstyle\sum_{j}p_{j}^{2}\boldsymbol{\Sigma}_{j} \bigr). \tag{2}
Two compositions induce the same law \mathcal{N}_G(\boldsymbol{\mu}\boldsymbol{p}, \boldsymbol{\Sigma}(\boldsymbol{p})) only if they coincide, provided that map is injective. Full column rank of \boldsymbol{\mu} (\operatorname{rank}(\boldsymbol{\mu})=J, equivalently linearly independent contrast columns \boldsymbol{\mu}_{\cdot j}-\boldsymbol{\mu}_{\cdot J}) is a convenient sufficient condition, because then the mean map alone is injective on the simplex. It is not necessary. Two cell types may share identical or collinear mean profiles and remain identifiable when their covariances differ: the second component of Eq. 2 still separates \boldsymbol{p}. Conversely, identical means and proportional covariances (\boldsymbol{\Sigma}_{2}=c\boldsymbol{\Sigma}_{1}) make the Gaussian family non-injective.
Identifiability is a property of the reference, not of the bulk sample: no amount of sequencing rescues a pair of types that agree in both mean and covariance. The mean-based condition number \kappa(\boldsymbol{\mu}) is therefore a misleading diagnostic in the covariance-only regime DeCovarT targets (see the feature-selection vignette). Near-collinear means are still reported as a warning by fit_decovart(); that warning does not by itself imply that \boldsymbol{p} is unidentifiable. Numerical illustrations live in the appendix simulations.
Existence
Proposition 2 (Existence of a maximiser)
If every \boldsymbol{\Sigma}_j is symmetric positive definite, then \boldsymbol{\Sigma}(\boldsymbol{p})=\sum_j p_j^{2}\boldsymbol{\Sigma}_j is positive definite for every \boldsymbol{p}\in\Delta^{J-1}, since at least one p_j>0 on the simplex. Hence Eq. 1 is finite and continuous on the compact set \Delta^{J-1}, and attains its supremum.
Two practical consequences. First, positive definiteness is preserved even when some proportions are exactly zero, which is what allows the restricted maximisation of restricted_mle_decovart() to represent a null such as p_j=0 exactly instead of pushing it through a logarithm. Second, the maximiser may lie on the boundary of the compact set, so first-order conditions \nabla\ell=\boldsymbol{0} are necessary only at interior optima.
Uniqueness fails for one observed sample
Existence is not uniqueness. The DeCovarT likelihood is a heteroscedastic Gaussian model: the noise covariance depends on the same parameter as the mean, so Eq. 1 is not the concave objective of an ordinary linear regression. Even in the isotropic case \boldsymbol{\Sigma}_1=\boldsymbol{\Sigma}_2=\mathbf{I}_G with J=2 and without the simplex constraint,
\ell(\boldsymbol{p}) = -\frac{G}{2}\log(p_1^{2}+p_2^{2}) - \frac{\lVert\boldsymbol{y}-\boldsymbol{\mu}\boldsymbol{p}\rVert^{2}} {2(p_1^{2}+p_2^{2})} +C , \tag{3}
whose variance term moves with the coefficients. A single evaluation of the analytic Hessian settles the question.
Every entry of \boldsymbol{y} and \boldsymbol{\mu} is strictly positive, \operatorname{rank}(\boldsymbol{\mu})=2, G=3>J=2, and both covariances are positive definite. Yet the Hessian at the strictly interior point \boldsymbol{p}=(1/5,3/10) has one positive and one negative eigenvalue.
Important 1: One indefinite Hessian disproves global concavity
A negative determinant at a single admissible point is a counterexample, so the unconstrained DeCovarT log-likelihood is not globally concave under the stated positivity and rank assumptions. The same conclusion transfers to the isometric log-ratio chart, because a C^{2} diffeomorphism preserves the existence of directions of positive curvature. Consequently:
- a converged optimiser certifies a local maximum at best;
- several starts may reach different modes (see Sec. 5);
- convex-optimisation guarantees — a unique global optimum reachable by descent, and duality certificates — do not apply (Boyd et al. 2004). The step safeguards of second-order solvers, the Newton trust region of
nlminband the Marquardt–Levenberg damping ofmarqLevAlg(Philipps et al. 2023, 2021), and the relative-distance-to-minimum criterion of Commenges et al. (2006) buy robustness against saddle points, not global optimality.
Population consistency and efficiency
The failure of concavity is a statement about one realised data set. The population criterion behaves much better. Let \boldsymbol{p}_0 be the truth and define Q(\boldsymbol{p};\boldsymbol{p}_0) =\mathbb{E}_{\boldsymbol{p}_0}\{\ell_{\boldsymbol{Y}}(\boldsymbol{p})\}.
Theorem 1 (Population uniqueness through the Kullback–Leibler divergence)
Q(\boldsymbol{p}_0;\boldsymbol{p}_0)-Q(\boldsymbol{p};\boldsymbol{p}_0) = D_{\mathrm{KL}}\bigl( P_{\boldsymbol{p}_0}\,\Vert\,P_{\boldsymbol{p}} \bigr) \ \ge\ 0 , \tag{4}
with equality if and only if P_{\boldsymbol{p}}=P_{\boldsymbol{p}_0}. Under Proposition 1 that happens only at \boldsymbol{p}=\boldsymbol{p}_0, so \boldsymbol{p}_0 is the unique maximiser of the expected log-likelihood.
Eq. 4 is an identifiability statement, not a curvature statement: it survives the non-concavity of Note 1. It is also the engine of the usual asymptotics — consistency, asymptotic normality and efficiency of the MLE (Vaart 2000) — because the local geometry of the divergence is the Fisher information. By the Fisher information metric theorem,
D_{\mathrm{KL}}\bigl( P_{\boldsymbol{p}_0}\,\Vert\,P_{\boldsymbol{p}_0+\boldsymbol{d}} \bigr) = \tfrac{1}{2}\, \boldsymbol{d}^{\top}I(\boldsymbol{p}_0)\,\boldsymbol{d} + o(\lVert\boldsymbol{d}\rVert^{2}) , \tag{5}
with I the expected information of expected_fisher_unconstrained(); the Gaussian case is treated in information-geometric terms by Malago and Pistone (2015). The identity is worth checking numerically, since it ties the plug-in vcov of a DeCovarT fit to the divergence that makes the MLE consistent.
kl_gaussian_convolution <- function(p_ref, p_alt, mu, Sigma) {
  mean_ref <- drop(mu %*% p_ref)
  mean_alt <- drop(mu %*% p_alt)
  cov_ref <- .compute_global_variance(p_ref, Sigma)
  cov_alt <- .compute_global_variance(p_alt, Sigma)
  precision_alt <- solve(cov_alt)
  shift <- mean_alt - mean_ref
  0.5 *
    (sum(diag(precision_alt %*% cov_ref)) -
      nrow(cov_ref) +
      drop(t(shift) %*% precision_alt %*% shift) +
      as.numeric(determinant(cov_alt, logarithm = TRUE)$modulus) -
      as.numeric(determinant(cov_ref, logarithm = TRUE)$modulus))
}

p_reference <- c(0.4, 0.6)
information <- expected_fisher_unconstrained(
  p_reference,
  mean_signature,
  Sigma_iso
)
steps <- c(1e-2, 1e-3, 1e-4)
data.frame(
  step = steps,
  kullback_leibler = vapply(
    steps,
    function(h) {
      kl_gaussian_convolution(
        p_reference,
        p_reference + c(h, -h / 2),
        mean_signature,
        Sigma_iso
      )
    },
    numeric(1)
  ),
  quadratic_form = vapply(
    steps,
    function(h) {
      d <- c(h, -h / 2)
      0.5 * drop(t(d) %*% information %*% d)
    },
    numeric(1)
  )
)
#>    step kullback_leibler quadratic_form
#> 1 1e-02     2.432446e-04   2.428254e-04
#> 2 1e-03     2.428691e-06   2.428254e-06
#> 3 1e-04     2.428298e-08   2.428254e-08
The two columns agree to the order of \lVert\boldsymbol{d}\rVert^{3}, as Eq. 5 predicts.
Finite-sample bias versus asymptotic unbiasedness
Theorem 1 is a statement about the expected criterion Q(\boldsymbol{p};\boldsymbol{p}_0). It does not say that the maximiser of one realised log-likelihood equals \boldsymbol{p}_0. Typical bulk deconvolution observes a single G-vector \boldsymbol{Y}_{\cdot i}\sim\mathcal{N}_G(\boldsymbol{\mu} \boldsymbol{p}_{\cdot i},\boldsymbol{\Sigma}(\boldsymbol{p}_{\cdot i})) and treats that column as N=1. The resulting MLE is then a nonlinear function of one Gaussian draw, so \mathbb{E}_{\boldsymbol{p}_0}(\hat{\boldsymbol{p}})\neq\boldsymbol{p}_0 in general: the leading bias of a regular MLE is O(N^{-1}) (Vaart 2000, ch. 5). The same map becomes consistent, and \sqrt{N}-normal with variance I(\boldsymbol{p}_0)^{-1}, once N i.i.d. bulk columns share one composition, because the averaged criterion converges to Q and Q has a unique maximiser at \boldsymbol{p}_0.
Two calculations are easy to confuse and are not the same.
Score identity. If the convolution is correctly specified, \mathbb{E}_{\boldsymbol{p}_0}\{\nabla\ell_{\boldsymbol{Y}}(\boldsymbol{p}_0)\}=\boldsymbol{0}. The identity is a property of the random bulk. It is what the Fisher metric of Eq. 5 linearises.
Mean-profile remainder. Substituting the conditional mean \boldsymbol{y}=\boldsymbol{\mu}\boldsymbol{p}_0 into the score of Eq. 1 kills the Mahalanobis terms and leaves only the derivative of -\tfrac12\log\det\boldsymbol{\Sigma}(\boldsymbol{p}). In unconstrained \boldsymbol{p}-coordinates that remainder is -p_j\operatorname{tr}\bigl(\boldsymbol{\Omega}(\boldsymbol{p}) \boldsymbol{\Sigma}_j\bigr) at each j, with \boldsymbol{\Omega}=\boldsymbol{\Sigma}(\boldsymbol{p})^{-1}. Mapped through the ILR chart it vanishes by symmetry when \boldsymbol{p}_0=(1/2,1/2) and \boldsymbol{\Sigma}_1=\boldsymbol{\Sigma}_2, and it does not vanish at an unbalanced interior point. Hence the maximiser of \ell(\,\cdot\,;\boldsymbol{\mu}\boldsymbol{p}_0) need not equal \boldsymbol{p}_0 even though that bulk sits at the centre of the model. The bias of the random MLE is a different, typically larger, effect: \hat{\boldsymbol{p}} is a nonlinear function of \boldsymbol{Y}, and near a simplex face the ILR chart sends p_j\to 0 to |\rho|\to\infty so that a plateau in \ell (see Sec. 4.3) inflates the O(N^{-1}) term.
Convex-optimisation guarantees do not close the gap. Boyd and Vandenberghe emphasise that a local maximum of a non-concave objective need not be global, and that first-order stationarity certifies optimality only under convexity (Boyd et al. 2004, ch. 1 and 4). Note 1 already exhibits an indefinite Hessian for one bulk, so a converged solver certifies a local maximiser of that sample’s \ell, not uniqueness and not unbiasedness. What is uniquely maximised is Q, and only after N\to\infty (or after pooling genuine replicates; Sec. 4.4) does \hat{\boldsymbol{p}}_N concentrate there.
mu_cld <- matrix(c(20, 22, 22, 20), nrow = 2)
Sigma_id <- array(c(diag(2), diag(2)), dim = c(2, 2, 2))
p_balanced <- c(0.5, 0.5)
p_rare <- c(0.99, 0.01)
y_at_mean <- function(p) {
  drop(mu_cld %*% p)
}
score_at_mean <- function(p) {
  gradient_loglik_constrained(
    isometric_log_ratio(p),
    y_at_mean(p),
    mu_cld,
    Sigma_id
  )
}
set.seed(1)
cov_rare <- .compute_global_variance(p_rare, Sigma_id)
mean_score_random <- mean(replicate(200, {
  y <- MASS::mvrnorm(
    n = 1,
    mu = y_at_mean(p_rare),
    Sigma = cov_rare
  )
  gradient_loglik_constrained(
    isometric_log_ratio(p_rare),
    y,
    mu_cld,
    Sigma_id
  )
}))
data.frame(
  composition = c("balanced 50-50", "rare type 0.01"),
  ilr_score_at_conditional_mean = c(
    score_at_mean(p_balanced),
    score_at_mean(p_rare)
  ),
  mean_ilr_score_at_truth = c(NA_real_, mean_score_random)
)
#>      composition ilr_score_at_conditional_mean mean_ilr_score_at_truth
#> 1 balanced 50-50                  4.598694e-17                      NA
#> 2 rare type 0.01                 -2.799572e-02            0.0004500902
The ILR score at the conditional mean is zero in the balanced isotropic case and of order 10^{-2} at p=(0.99,0.01). Averaging the same score over random \boldsymbol{Y}\sim\mathcal{N}_G(\boldsymbol{\mu}\boldsymbol{p}_0,
\boldsymbol{\Sigma}(\boldsymbol{p}_0)) returns a number consistent with zero, as the information identity requires. Finite-sample bias of \hat{\boldsymbol{p}} is therefore not a failure of \mathbb{E}(\nabla\ell)=0; it is the nonlinearity of the maximiser, amplified when Eq. 1 is nearly flat along a simplex face. The bivariate and covariance-driven Monte Carlo packs in output/fig02/mle_explanation/ and output/fig03/mle_explanation/ quantify that geometry for N=1 (see the bivariate toy and the covariance-driven scenario). A Jeffreys / Firth adjustment of \ell (Firth 1993) shrinks the O(N^{-1}) term when replicates are scarce (Sec. 3.8).
Equivariance: affine yes, logarithmic no
Proposition 3 (Gene-wise affine equivariance)
Let \boldsymbol{\Lambda}=\operatorname{diag}(\varsigma_1,\ldots,\varsigma_G) with \varsigma_g\neq 0 and \boldsymbol{t}\in\mathbb{R}^{G}. Applying the same gene-wise map to all three inputs,
\boldsymbol{y}^{\star}=\boldsymbol{\Lambda}^{-1}(\boldsymbol{y}-\boldsymbol{t}), \quad \boldsymbol{\mu}^{\star} =\boldsymbol{\Lambda}^{-1}(\boldsymbol{\mu}-\boldsymbol{t}\mathbf{1}_J^{\top}), \quad \boldsymbol{\Sigma}_j^{\star}=\boldsymbol{\Lambda}^{-1}\boldsymbol{\Sigma}_j \boldsymbol{\Lambda}^{-1},
leaves the MLE unchanged, because \mathbf{1}_J^{\top}\boldsymbol{p}=1 makes the recentring cancel and the Mahalanobis residual is invariant.
A z-score computed once per gene from \boldsymbol{\mu} is such a map, which is why fit_decovart(standardise = TRUE) is safe. Per-cell-type or per-sample scaling is not, and neither is a logarithm: \log is concave, so Jensen’s inequality shifts both moments and \log(\boldsymbol{\mu}\boldsymbol{p})
\neq(\log\boldsymbol{\mu})\boldsymbol{p}. Reference-based deconvolution therefore expects a non-log linear scale (Newman et al. 2015): keep raw counts (or a linear normalisation such as CPM/TPM) rather than \log_2 values. Monotonicity of \log preserves gene-wise rankings, but not the convolution MLE. The numerical demonstration lives in the appendix simulations.
Expected Fisher information and Wald inference
Point estimation alone does not report uncertainty. Under a regular large-sample regime the MLE is asymptotically normal with covariance given by the inverse Fisher information. DeCovarT builds Wald standard errors from the expected Fisher information of the multivariate-normal convolution, then maps that information through the ILR chart.
Unconstrained expected Fisher information
For \boldsymbol{y}\sim\mathcal{N}_{G}\bigl(\boldsymbol{\mu}\boldsymbol{p}, \boldsymbol{\Sigma}(\boldsymbol{p})\bigr) the expected Fisher information has entries
I(\boldsymbol{p})_{j\ell} = \boldsymbol{\mu}_{\cdot j}^{\top} \boldsymbol{\Omega}(\boldsymbol{p}) \boldsymbol{\mu}_{\cdot \ell} + 2p_{j}p_{\ell}\, \mathrm{tr}\bigl( \boldsymbol{\Omega}(\boldsymbol{p})\boldsymbol{\Sigma}_{j} \boldsymbol{\Omega}(\boldsymbol{p})\boldsymbol{\Sigma}_{\ell} \bigr). \tag{6}
The first summand is the mean contribution (a \boldsymbol{\Omega}-inner product of signature columns); the second is the covariance contribution of the quadratic map \boldsymbol{p}\mapsto\boldsymbol{\Sigma}(\boldsymbol{p}). See the multivariate-normal formula on Wikipedia: Fisher information. expected_fisher_unconstrained() implements Eq. 6.
Note 2: Observed versus expected information
The analytic Hessian of the unconstrained score and Hessian is the observed information (up to sign). Wald intervals in
decovart_fituse the expected information Eq. 6, which does not depend on the residual \boldsymbol{y}-\boldsymbol{\mu}\boldsymbol{p} and is positive definite under the usual full-rank assumptions on (\boldsymbol{\mu},\{\boldsymbol{\Sigma}_{j}\}).The two are consistent by construction. Substituting \mathbb{E}[\boldsymbol{r}]=\boldsymbol{0} and \mathbb{E}[\boldsymbol{r}\boldsymbol{r}^{\top}] =\boldsymbol{\Sigma}(\boldsymbol{p}) into the diagonal and off-diagonal Hessian entries cancels the determinant traces against the residual traces and returns Eq. 6 exactly, i.e. \mathbb{E}[-\mathbf{H}]=I(\boldsymbol{p}). That identity only holds with the factor \tfrac{1}{2} on the determinant term in place.
Constrained case: ILR delta method
Fisher information transforms as a covariant quadratic form under the ILR chart. With the ILR Jacobian \mathbf{J}_{\boldsymbol{\psi}}=\mathbf{S}(\boldsymbol{p})\mathbf{V},
I_{\boldsymbol{\rho}} = \mathbf{J}_{\boldsymbol{\psi}}^{\mathsf{T}} I(\boldsymbol{p}) \mathbf{J}_{\boldsymbol{\psi}} = \mathbf{V}^{\mathsf{T}} \mathbf{S}(\boldsymbol{p}) I(\boldsymbol{p}) \mathbf{S}(\boldsymbol{p}) \mathbf{V}. \tag{7}
The mean/covariance split of Eq. 6 pulls back separately, I_{\boldsymbol{\rho}}=I_{\boldsymbol{\rho},\mathrm{mean}}
+I_{\boldsymbol{\rho},\mathrm{cov}}. Under regularity, \hat{\boldsymbol{\rho}}
\overset{a}{\sim}
\mathcal{N}(\boldsymbol{\rho}_{0},I_{\boldsymbol{\rho}}^{-1}) (Vaart 2000). The first-order delta method (Oehlert 1992) then returns the simplex covariance used by vcov.decovart_fit(),
\mathrm{Var}(\hat{\boldsymbol{p}}) \approx \mathbf{J}_{\boldsymbol{\psi}} I_{\boldsymbol{\rho}}^{-1} \mathbf{J}_{\boldsymbol{\psi}}^{\mathsf{T}}. \tag{8}
Diagonal square roots are asymptotic standard errors; Wald intervals at level 1-\alpha are \hat{p}_{j}\pm z_{1-\alpha/2}\,\mathrm{SE}_{j} with z_{q}=\Phi^{-1}(q), as in confint.decovart_fit(). vcov_ilr_delta() implements Eq. 7–Eq. 8. Orthogonal rotations of \mathbf{V} leave Eq. 8 unchanged. The construction is undefined on the simplex boundary (the log-ratio chart blows up); the helper then returns NA with a warning.
Warning 3: Wald is the cheapest, not the safest, interval
Eq. 8 linearises the ILR chart at \hat{\boldsymbol{p}}, so it is neither invariant to a non-orthogonal reparametrisation nor confined to [0,1], and it degenerates entirely when a proportion reaches a simplex face. Sec. 3 and Sec. 4 derive the alternatives: profile likelihood-ratio intervals, the chi-bar-square calibration of Chernoff and of Self and Liang for nulls on the boundary, a parametric bootstrap, and a reference-sample bootstrap of donors or cells (or a Dirichlet composition sweep). It also shows why these limits need replicate samples that share one composition. Shuffling genes or cell-type names of an averaged signature is not a bootstrap: the maximised likelihood is equivariant under relabelling.
Confidence intervals for the proportions
The solver returns \hat{\boldsymbol{\rho}} and an information matrix in \boldsymbol{\rho}-coordinates, I_{\boldsymbol{\rho}}=\mathbf{J}_{\boldsymbol{\psi}}^{\top}I(\boldsymbol{p})\mathbf{J}_{\boldsymbol{\psi}} with \mathbf{J}_{\boldsymbol{\psi}}=\mathbf{S}(\boldsymbol{p})\mathbf{V} (Sec. 2.2). This section follows the generalised-linear-model treatment of likelihood inference (Agresti 2015, Sects. 4.2–4.3): state when the large-sample approximation holds (Sec. 3.1), read the local geometry of the log-likelihood (Sec. 3.2), define the three first-order tests (Sec. 3.3), and invert them into intervals (Sec. 3.4). The remaining subsections treat the routes from \boldsymbol{\rho} to \boldsymbol{p}, nuisance scales, and corrections beyond first order.
Regularity conditions and two asymptotic regimes
Proposition 4 (Large-sample normality and the three first-order tests)
Let \boldsymbol{y}_{\cdot 1},\ldots,\boldsymbol{y}_{\cdot N} be independent bulk profiles of N biological samples that share one composition \boldsymbol{p}_0, and write \boldsymbol{\rho}_0=\mathbf{V}^{\top}\log\boldsymbol{p}_0. Assume that
- (R1) identifiability: distinct compositions give distinct laws (Proposition 1);
- (R2) interior truth: \boldsymbol{p}_0 lies in the open simplex, so \boldsymbol{\rho}_0 is a finite point of the open set \mathbb{R}^{J-1};
- (R3) fixed dimension: the number of free parameters J-1, and the number of genes G, stay fixed while N\to\infty;
- (R4) smoothness: the log-density is three times continuously differentiable in \boldsymbol{\rho} near \boldsymbol{\rho}_0, with third derivatives bounded by an integrable function;
- (R5) information: the per-sample Fisher information I_{\boldsymbol{\rho}}(\boldsymbol{\rho}_0) is finite and positive definite;
- (R6) fixed support: the support of the law does not depend on \boldsymbol{\rho}, and differentiation and integration can be interchanged.
Then, with probability tending to one, the likelihood equation has a consistent root \hat{\boldsymbol{\rho}}, and
\sqrt{N}\,(\hat{\boldsymbol{\rho}}-\boldsymbol{\rho}_0) \ \rightsquigarrow\ \mathcal{N}_{J-1}\bigl(\boldsymbol{0},I_{\boldsymbol{\rho}}(\boldsymbol{\rho}_0)^{-1}\bigr). \tag{9}
For a null hypothesis that fixes k smooth functions of \boldsymbol{\rho}, the Wald, likelihood-ratio and score statistics of Sec. 3.3 all converge to \chi^{2}_{k} and differ by o_P(1) (Cox and Hinkley 1979, Sects. 9.2–9.3).
The Gaussian convolution meets (R4) and (R6) on the open simplex, because \boldsymbol{\Sigma}(\boldsymbol{p}) is positive definite on the closed simplex (Sec. 1.2). The other conditions are where DeCovarT can fail.
- (R5) fails when two signature columns are collinear and the covariances do not separate the types: the information is singular along their contrast.
- (R2) fails when a type is absent. The limit is then the chi-bar-square mixture of Sec. 4.3, not a Gaussian.
- (R3) fixes the direction of the limit. The replication unit is the biological sample i, not the gene: the G genes are correlated by construction, and their dependence through \boldsymbol{\Sigma}(\boldsymbol{p}) is the point of the model. A design that gives every new sample its own composition adds parameters as fast as observations, so no single composition gains information (Cox and Hinkley 1979, 81). Sec. 4.4 draws the practical consequences.
Small-dispersion asymptotics. Proposition 4 needs replicates. A single bulk sample still has an asymptotic direction under the single-cell model of Eq. 23: with \tilde{\boldsymbol{y}}_{\cdot i}=\boldsymbol{y}_{\cdot i}/c_i,
\tilde{\boldsymbol{y}}_{\cdot i}\sim \mathcal{N}_G\bigl(\tilde{\boldsymbol{\mu}}\boldsymbol{p}_{\cdot i},\; n_i^{-1}\boldsymbol{S}_W(\boldsymbol{p}_{\cdot i})\bigr), \tag{10}
so the number of cells n_i plays the role of the index parameter of a dispersion model, and 1/n_i that of the dispersion. For a single observation from a dispersion model, Jørgensen (1987) proves consistency, the limit n_i^{1/2}(\hat{\boldsymbol{\beta}}-\boldsymbol{\beta}_0)\rightsquigarrow \mathcal{N}(\boldsymbol{0},i(\boldsymbol{\beta}_0)^{-1}), and \chi^{2} limits for differences of deviances, as the index n_i\to\infty with the sample size fixed (his Theorems 4.1–4.3). His conditions mirror (R2), (R4) and (R5): an open parameter set, a full-rank local design matrix and a positive-definite information. Large expected counts in contingency tables are the classical special case. Five points carry this result to DeCovarT.
- Not exactly a dispersion model (our remark). In Eq. 10 the term -\tfrac12\log\det\boldsymbol{S}_W(\boldsymbol{p}) is not multiplied by n_i. It is O(1) against the O(n_i) Mahalanobis term, so the information is dominated by its mean part, n_i\mathbf{J}_{\boldsymbol{\psi}}^{\top}\tilde{\boldsymbol{\mu}}^{\top}\boldsymbol{S}_W^{-1}\tilde{\boldsymbol{\mu}}\mathbf{J}_{\boldsymbol{\psi}}, and the quasi-score of Sec. 6.3 becomes efficient in this limit. The proof still has to be written.
- Every type must grow. The Gaussian law of the bulk is itself a central-limit approximation over the cells of each type, so the limit needs every count m_{ji}=n_ip_{ji} to grow, not only n_i. A rare type with few cells breaks the approximation first.
- Unknown dispersion. Jørgensen estimates the dispersion by the deviance divided by its degrees of freedom (his Sect. 4.5). Here that is the Pearson estimate \hat\phi on G-J degrees of freedom: G must exceed J by a margin, and t or F quantiles replace normal and \chi^{2} ones when G-J is small.
-
Reference error does not shrink. The moments (\tilde{\boldsymbol{\mu}},\boldsymbol{\Sigma}_{W,j}) come from C_j cells. Their error does not decrease with n_i and dominates once n_i\gg C_j, which
reference_bootstrap_decovart()propagates (Sec. 4.6). - The released model has no index. The covariance \sum_jp_j^{2}\boldsymbol{\Sigma}_j of Eq. 1 does not scale with a number of cells, so only the replicate limit of Proposition 4 is available for it.
Local geometry of the log-likelihood
Every first-order interval reads the curvature at the estimate. Near \hat{\boldsymbol{\rho}},
\ell(\boldsymbol{\rho})-\ell(\hat{\boldsymbol{\rho}}) \approx -\tfrac12(\boldsymbol{\rho}-\hat{\boldsymbol{\rho}})^{\top} \boldsymbol{j}(\hat{\boldsymbol{\rho}}) (\boldsymbol{\rho}-\hat{\boldsymbol{\rho}}), \qquad \boldsymbol{j}=-\nabla^{2}_{\boldsymbol{\rho}}\ell , \tag{11}
and a scalar Wald half-width is z_{1-\alpha/2}\,\boldsymbol{j}^{-1/2}. A sharp peak gives a narrow interval, a plateau a wide one, and a ridge, as along the contrast of two collinear signatures, an elongated ellipse. The approximation is exact in one case: a Gaussian response with identity link and known covariance has a log-likelihood that is a second-degree polynomial in the coefficients. There the Wald, likelihood-ratio and score statistics are equal, their \chi^{2} law is exact, and the symmetric interval is exact (Agresti 2015, sect. 4.3). DeCovarT departs from that case in three ways.
- The covariance depends on the parameter. \boldsymbol{\Sigma}(\boldsymbol{p}) enters the log-determinant and the Mahalanobis weights, so \ell is not quadratic even in \boldsymbol{p}, where the mean is linear.
- The chart is nonlinear. The mean \boldsymbol{\mu}\boldsymbol{\psi}(\boldsymbol{\rho}) is not linear in \boldsymbol{\rho}.
- Faces flatten the likelihood. p_j\to0 sends \rho to infinity, and \ell levels off along that direction. With few replicates, an unbalanced composition or overlapping types, the profile is skewed and its plateau wide. The ILR slices of the covariance-driven scenario show these ridges along the contrast of the two mean-collinear types.
The geometry is also a diagnostic of non-normality. Compare the Wald, score and likelihood-ratio intervals for the same estimate, and plot the signed root r(\tau) of Eq. 13 against the Wald pivot (\hat\tau-\tau)/\mathrm{SE}: the two curves coincide when \ell is quadratic, and a curved r(\tau) or a large gap between the three intervals flags a non-Gaussian geometry. Ratios of the three statistics also detect the Hauck–Donner effect (Yee 2022).
Wald, likelihood-ratio and score tests
Partition \boldsymbol{\vartheta}=(\boldsymbol{\tau},\boldsymbol{\eta}) into k parameters of interest and nuisance parameters (other proportions, scales), test H_0:\boldsymbol{\tau}=\boldsymbol{\tau}_0, write \tilde{\boldsymbol{\vartheta}}_0=(\boldsymbol{\tau}_0,\hat{\boldsymbol{\eta}}_{\boldsymbol{\tau}_0}) for the restricted estimate, and I^{\tau\tau} for the \boldsymbol{\tau} block of I^{-1} (Cox and Hinkley 1979, sect. 9.3; Agresti 2015, sect. 4.3):
W=(\hat{\boldsymbol{\tau}}-\boldsymbol{\tau}_0)^{\top} \{I^{\tau\tau}(\hat{\boldsymbol{\vartheta}})\}^{-1} (\hat{\boldsymbol{\tau}}-\boldsymbol{\tau}_0), \quad \mathcal{D}=2\{\ell(\hat{\boldsymbol{\vartheta}})-\ell(\tilde{\boldsymbol{\vartheta}}_0)\}, \quad S=\boldsymbol{U}_{\tau}(\tilde{\boldsymbol{\vartheta}}_0)^{\top} I^{\tau\tau}(\tilde{\boldsymbol{\vartheta}}_0) \boldsymbol{U}_{\tau}(\tilde{\boldsymbol{\vartheta}}_0). \tag{12}
| Wald W | Likelihood ratio \mathcal{D} | Score S | |
|---|---|---|---|
| Fits needed | unrestricted | both | restricted |
| Evaluated at | \hat{\boldsymbol{\vartheta}} (curvature) | both (height) | \tilde{\boldsymbol{\vartheta}}_0 (slope) |
| Smooth reparametrisation | changes it | invariant | invariant (expected information) |
| Simplex face | undefined | chi-bar-square (Sec. 4.3) | defined in \boldsymbol{p} coordinates |
| Interval shape | symmetric | asymmetric | asymmetric |
- Rao’s score test is the Lagrange-multiplier test. At the restricted maximum, the multiplier of the constraint \boldsymbol{\tau}=\boldsymbol{\tau}_0 equals the score \boldsymbol{U}_{\tau}(\tilde{\boldsymbol{\vartheta}}_0), so the two names describe one statistic.
- Linear constraints. The likelihood ratio tests any nested hypothesis, including k linear constraints \boldsymbol{C}\boldsymbol{p}=\boldsymbol{d}, with \mathcal{D}\rightsquigarrow\chi^{2}_k. In a lineage-aware fit, the hypothesis that two child lines occur in the ratio w_0 measured in their parental line is p_{c_1}-w_0(p_{c_1}+p_{c_2})=0, one linear constraint. The restricted set is still a polytope, but the constraint is not linear in \boldsymbol{\rho}, so the restricted fit is done in \boldsymbol{p}.
- Asymptotic equivalence. Under Proposition 4 the three statistics differ by o_P(1) (Cox and Hinkley 1979, sect. 9.3). They disagree in finite samples exactly when the geometry of Sec. 3.2 is not quadratic.
-
The relative distance to the maximum is a score statistic. The stopping rule of the Marquardt–Levenberg solver is \mathrm{RDM}=m^{-1}\boldsymbol{U}(\boldsymbol{\vartheta}_k)^{\top}\boldsymbol{G}(\boldsymbol{\vartheta}_k)^{-1}\boldsymbol{U}(\boldsymbol{\vartheta}_k), with \boldsymbol{G} an estimate of the variance of the score (outer products of individual scores in the robust-variance scoring algorithm, the Hessian in
marqLevAlg). It is a score statistic for the null “the iterate \boldsymbol{\vartheta}_k is the maximiser”, divided by the number m of parameters, and Commenges et al. note that inverting \boldsymbol{U}^{\top}\boldsymbol{G}^{-1}\boldsymbol{U}\le\chi^{2}_{m,1-\alpha} gives a confidence region (Commenges et al. 2006, 10 and 13). The difference with Rao’s test is the null: a numerical statement about the iterate, not a scientific hypothesis on \boldsymbol{p}.
Confidence intervals by test inversion
A (1-\alpha) confidence set is the set of null values that a level-\alpha test does not reject, \{\tau_0:T(\tau_0)\le\chi^{2}_{1,1-\alpha}\} for each statistic of Eq. 12.
Wald. The information is evaluated once, at \hat\tau, so the set is the symmetric interval \hat\tau\pm z_{1-\alpha/2}\mathrm{SE}(\hat\tau).
Score. The information is re-evaluated at each candidate \tau_0, so the interval is asymmetric. For a binomial proportion it is the Wilson interval (Wilson 1927). The score is computed at the restricted fit only, which on the simplex can sit on a face.
-
Likelihood ratio. \mathcal{D}(\tau_0) is zero at \hat\tau and grows on both sides, so \{\tau_0:\mathcal{D}(\tau_0)\le\chi^{2}_{1,1-\alpha}\} has a lower and an upper endpoint, where the profile deviance crosses the cut-off on each side of \hat\tau. The \chi^{2}_1 test is two-sided because it squares the signed likelihood root
r(\tau_0)=\operatorname{sign}(\hat\tau-\tau_0)\sqrt{\mathcal{D}(\tau_0)} \ \rightsquigarrow\ \mathcal{N}(0,1). \tag{13}
The lower limit solves r(\tau_L)=z_{1-\alpha/2}, the upper limit r(\tau_U)=-z_{1-\alpha/2}, and z_{1-\alpha} gives one-sided limits. If \mathcal{D} stays below the cut-off all the way to the face p_j=0, the lower limit is 0.
Several parameters. The joint region \{\boldsymbol{\tau}_0:\mathcal{D}(\boldsymbol{\tau}_0)\le\chi^{2}_{k,1-\alpha}\}, with the remaining proportions and the scales profiled out as nuisance parameters (Sec. 3.6), has simultaneous coverage.
Software. confint_profile_decovart() inverts Eq. 20 for DeCovarT. For generalised linear models, stats::confint() inverts the signed root of the profile, and ProfileLikelihood plots normalised profiles and likelihood support intervals for linear, generalised linear and mixed models. Of the higher-order packages, likelihoodAsy computes r and r^{\ast} (Sec. 3.7) for any scalar function of the parameters from a user-supplied log-likelihood and data simulator, so it applies to DeCovarT with simulate_bulk_mixture(), whereas cond is restricted to logistic and log-linear models.
From \boldsymbol{\rho} to \boldsymbol{p}: delta method or back-transformation
A Wald statement in \boldsymbol{\rho} still has to be carried to the proportions. Agresti’s advice for fitted values applies: the delta method gives their covariance, but an interval formed on the scale of the linear predictor and mapped by the inverse link avoids the further approximation (Agresti 2015, sect. 4.2.5).
-
Delta method on \boldsymbol{p}. \operatorname{Var}(\hat{\boldsymbol{p}})\approx\mathbf{J}_{\boldsymbol{\psi}}I_{\boldsymbol{\rho}}^{-1}\mathbf{J}_{\boldsymbol{\psi}}^{\top} and \hat p_j\pm z_{1-\alpha/2}\mathrm{SE}_j. This is the default of
confint.decovart_fit(). It is symmetric, and nothing keeps its endpoints inside [0,1]. - Back-transformation through the ILR chart. A smooth, monotone map preserves quantiles. For J=2, p_1=\operatorname{logistic}(\sqrt{2}\,\rho) is monotone, so [\psi(\hat\rho-z\,\mathrm{SE}),\psi(\hat\rho+z\,\mathrm{SE})] has exactly the coverage of the interval for \rho, lies inside (0,1) and is asymmetric around \hat p_1. For J>2 each p_j depends on all J-1 coordinates, but the bijection \boldsymbol{\psi} maps joint regions exactly, \Pr(\boldsymbol{\rho}\in R)=\Pr\{\boldsymbol{p}\in\boldsymbol{\psi}(R)\}. Marginal intervals are the quantiles of \boldsymbol{p}^{(b)}=\boldsymbol{\psi}(\boldsymbol{\rho}^{(b)}) with \boldsymbol{\rho}^{(b)}\sim\mathcal{N}(\hat{\boldsymbol{\rho}},I_{\boldsymbol{\rho}}^{-1}). Every draw is a composition, so the intervals lie inside (0,1) and respect the sum-to-one constraint jointly; for J=2 they reduce to the endpoint map.
Why not a multinomial logit renormalisation. Three alternatives were considered and are not kept.
- The free softmax of J scores, the machine-learning form of the multinomial logit in Burakov’s chapter (PDF), is not identifiable: \operatorname{softmax}(\boldsymbol{z}+t\mathbf{1})=\operatorname{softmax}(\boldsymbol{z}), and its information is singular along \mathbf{1}.
- The multinomial logit with a reference type is the ALR chart. It is a linear transform of the ILR chart, so it gives the same estimate, the same likelihood ratio, the same delta-method covariance of \hat{\boldsymbol{p}} and the same back-transformed regions (chart invariance). The ILR chart is kept for its numerical invariance: gradient norms, damping and conditioning do not depend on a reference type.
- A component-wise logit interval, the delta method applied to \operatorname{logit}\hat p_j with \mathrm{SE}(\operatorname{logit}\hat p_j)=\mathrm{SE}(\hat p_j)/\{\hat p_j(1-\hat p_j)\}, stacks a second delta method on the first and does not use the chart the model was fitted in.
The transformation guarantees the bounds, not the coverage: both routes rest on the same normal approximation of \hat{\boldsymbol{\rho}}. The simulation below checks both on an unbalanced three-type mixture with a rare type (p_3=0.03), refitting DeCovarT on independent bulk draws of one composition.
set.seed(2026)
n_genes <- 8L
n_types <- 3L
n_rep <- 300L
mu_cov <- matrix(
  rgamma(n_genes * n_types, shape = 4, rate = 0.2),
  n_genes,
  n_types,
  dimnames = list(paste0("gene_", seq_len(n_genes)), paste0("ct", seq_len(n_types)))
)
Sigma_cov <- array(
  0,
  c(n_genes, n_genes, n_types),
  dimnames = list(rownames(mu_cov), rownames(mu_cov), colnames(mu_cov))
)
for (j in seq_len(n_types)) {
  loadings <- matrix(rnorm(n_genes^2, sd = 0.3), n_genes)
  Sigma_cov[, , j] <- crossprod(loadings) + diag(n_genes)
}
p_true <- c(ct1 = 0.85, ct2 = 0.12, ct3 = 0.03)
bulk <- simulate_bulk_mixture(mu_cov, Sigma_cov, p = p_true, n = n_rep)$Y
fit_cov <- fit_decovart(mu_cov, bulk, Sigma = Sigma_cov, itmax = 200)
p_hat <- coef(fit_cov)

z_crit <- qnorm(0.975)
interval_routes <- function(p, n_draws = 2000L) {
  rho <- isometric_log_ratio(p)
  jac <- jacobian_isometric_logistic(rho)
  info_rho <- t(jac) %*%
    expected_fisher_unconstrained(p, mu_cov, Sigma_cov) %*%
    jac
  vcov_rho <- solve(info_rho)
  se_p <- sqrt(diag(jac %*% vcov_rho %*% t(jac)))
  draws <- MASS::mvrnorm(n_draws, rho, vcov_rho)
  p_draws <- t(apply(draws, 1L, isometric_logistic))
  list(
    delta = cbind(p - z_crit * se_p, p + z_crit * se_p),
    back_transformed = t(
      apply(p_draws, 2L, quantile, probs = c(0.025, 0.975))
    )
  )
}

# Both routes need an interior estimate: on a face the ILR chart
# diverges and the information in rho is singular.
interior <- apply(p_hat, 2L, min) > 1e-6
routes <- lapply(which(interior), function(i) interval_routes(p_hat[, i]))

summarise_route <- function(name) {
  lower <- sapply(routes, function(r) r[[name]][, 1])
  upper <- sapply(routes, function(r) r[[name]][, 2])
  data.frame(
    route = name,
    cell_type = names(p_true),
    coverage = rowMeans(lower <= p_true & p_true <= upper),
    outside_unit_interval = rowMeans(lower < 0 | upper > 1),
    median_width = apply(upper - lower, 1L, median)
  )
}
route_summary <- do.call(
  rbind,
  lapply(c("delta", "back_transformed"), summarise_route)
)
rownames(route_summary) <- NULL
knitr::kable(route_summary, digits = 3)| route | cell_type | coverage | outside_unit_interval | median_width |
|---|---|---|---|---|
| delta | ct1 | 0.963 | 0.083 | 0.174 |
| delta | ct2 | 0.953 | 0.353 | 0.209 |
| delta | ct3 | 0.970 | 0.733 | 0.090 |
| back_transformed | ct1 | 0.890 | 0.000 | 0.215 |
| back_transformed | ct2 | 0.987 | 0.000 | 0.231 |
| back_transformed | ct3 | 0.953 | 0.000 | 0.120 |
Out of 300 fits, 0 returned an estimate on a simplex face, where neither route is defined; the table is computed on the 300 interior fits. Three readings follow.
- The delta method places 73% of the intervals for the rare type partly below zero. Truncating them at zero would hide, not fix, the problem.
- The back-transformed intervals never leave (0,1) and are wider for the rare type, as an asymmetric interval should be.
- Neither route is calibrated for every type, and they miss in opposite directions. The delta method reaches its nominal coverage only by spending most of the rare-type interval on negative proportions; the back-transformed route covers the abundant type in 89% of the fits. The normal approximation of \hat{\boldsymbol{\rho}} is the weak link, and the routes only change how its error is mapped to the simplex.
The delta method on \boldsymbol{p} is therefore defensible only for balanced mixtures with few types, where every \hat p_j is far from zero. Otherwise report the back-transformed interval, or the profile interval of Sec. 4.2, which needs no normal approximation of \hat{\boldsymbol{\rho}} at all.
Nuisance scales: profile likelihood and orthogonality
In Eq. 23 the scales \boldsymbol{\eta}=(\log c_i,\log\phi_i) are technical nuisance parameters and \boldsymbol{\rho}_i is the parameter of interest. Concentrating them out gives the profile log-likelihood \ell^{\ast}(\boldsymbol{\rho})=\ell(\boldsymbol{\rho},\hat{\boldsymbol{\eta}}(\boldsymbol{\rho})).
Definition 1 (Envelope theorem)
Let \ell^{\ast}(\boldsymbol{\rho})=\max_{\boldsymbol{\eta}}\ell(\boldsymbol{\rho},\boldsymbol{\eta}) with a differentiable maximiser \hat{\boldsymbol{\eta}}(\boldsymbol{\rho}). Then
\nabla\ell^{\ast}(\boldsymbol{\rho}) =\nabla_{\boldsymbol{\rho}}\ell(\boldsymbol{\rho},\boldsymbol{\eta}) \big\rvert_{\boldsymbol{\eta}=\hat{\boldsymbol{\eta}}(\boldsymbol{\rho})}, \tag{14}
because the chain-rule term \{\partial\hat{\boldsymbol{\eta}}/\partial\boldsymbol{\rho}^{\top}\}^{\top}\nabla_{\boldsymbol{\eta}}\ell vanishes where \nabla_{\boldsymbol{\eta}}\ell=\boldsymbol{0}.
Eq. 14 is how the profile score of the single-cell model is obtained without differentiating the closed-form \hat c(\boldsymbol{p}) and \hat\phi(\boldsymbol{p}). Differentiating once more, and using \partial\hat{\boldsymbol{\eta}}/\partial\boldsymbol{\rho}^{\top}=-\boldsymbol{j}_{\eta\eta}^{-1}\boldsymbol{j}_{\eta\rho} from the implicit function theorem, gives the Schur complement
-\nabla^{2}\ell^{\ast}(\boldsymbol{\rho}) =\boldsymbol{j}_{\rho\rho}-\boldsymbol{j}_{\rho\eta}\boldsymbol{j}_{\eta\eta}^{-1}\boldsymbol{j}_{\eta\rho}, \tag{15}
so profile and joint Wald intervals for \boldsymbol{\rho} agree, and estimating the scales widens them by the loss of the Schur-complement information.
Orthogonality. Cox and Reid (1987) call \boldsymbol{\rho} and \boldsymbol{\eta} orthogonal when the cross block of the expected information vanishes, I_{\rho\eta}=\boldsymbol{0}, so that the information is block diagonal. Orthogonality implies that \hat{\boldsymbol{\rho}} and \hat{\boldsymbol{\eta}} are asymptotically independent, that the standard error of \hat{\boldsymbol{\rho}} is the same whether \boldsymbol{\eta} is known or estimated, and that \hat{\boldsymbol{\eta}}_{\tau} varies only by O_P(N^{-1}) with \tau (their Sect. 2.2). In a generalised linear model the dispersion is orthogonal to the mean parameters (their Sect. 3.2), which is why a GLM interval for the coefficients does not depend on how the dispersion is estimated.
The single-cell model is only partly orthogonal: I_{c\phi}=0, but I_{p_jc}=c\,\tilde{\boldsymbol{\mu}}_{\cdot j}^{\top}\boldsymbol{W}\tilde{\boldsymbol{\mu}}\boldsymbol{p}/\phi\neq0 and I_{p_j\phi}=\operatorname{tr}(\boldsymbol{W}\boldsymbol{\Sigma}_{W,j})/(2\phi)\neq0, with \boldsymbol{W}=\boldsymbol{S}_W(\boldsymbol{p})^{-1}. The block structure is derived for every alignment strategy in the single-cell vignette. A scalar interest parameter can always be made orthogonal to the nuisance by solving a system of partial differential equations, whereas a vector one in general cannot (their Sect. 2.3), so orthogonalising the whole of \boldsymbol{\rho} is not available in general. With orthogonal nuisance parameters, the Cox–Reid adjusted profile log-likelihood
\ell_{\mathrm{CR}}(\tau)=\ell^{\ast}(\tau) -\tfrac12\log\det\boldsymbol{j}_{\eta\eta}(\tau,\hat{\boldsymbol{\eta}}_{\tau}) \tag{16}
corrects the profile for the estimation of \boldsymbol{\eta}, as restricted maximum likelihood does for a variance. The plug-in strategy is the opposite choice: fix the scales from external data and accept the variance correction that propagating their uncertainty requires.
Higher-order likelihood asymptotics
The first-order statistics have errors r\sim\mathcal{N}(0,1)+O(n^{-1/2}) and \mathcal{D}\sim\chi^{2}_k+O(n^{-1}). Here n is not necessarily a sample size: “it can also be another parameter of the likelihood that controls the convergence of the likelihood to the asymptotic limit” (Canonero et al. 2023, 3), which for DeCovarT is the number of replicates N or the number of cells n_i (Sec. 3.1). Two corrections reduce the error when n is small or the log-likelihood is far from quadratic.
- Modified likelihood root. r^{\ast}=r+r^{-1}\log(\upsilon/r)\sim\mathcal{N}(0,1)+O(n^{-3/2}), where \upsilon is built from sample-space derivatives of \ell at the unrestricted and restricted estimates, with a nuisance adjustment \{\det\boldsymbol{j}_{\tau\tau}(\hat{\boldsymbol{\vartheta}})/\det\boldsymbol{j}_{\eta\eta}(\tilde{\boldsymbol{\vartheta}}_0)\}^{1/2}, or from a tangent exponential model when \ell cannot be written as a function of the estimates. It needs a scalar interest parameter and, like r, keeps a sign, so it gives lower and upper limits.
- Bartlett correction. \mathcal{D}^{\ast}=k\mathcal{D}/\mathbb{E}(\mathcal{D}) matches the mean of \chi^{2}_k, and the error of the \chi^{2}_k approximation falls to O(n^{-2}). \mathbb{E}(\mathcal{D}) comes from Lawley’s expansion or from a parametric bootstrap at the restricted estimate.
Both corrections give intervals by the inversion of Sec. 3.4. In the comparison of Canonero et al. (2023), the Bartlett correction was the more reliable: r^{\ast} became numerically unstable when the log-likelihood was strongly non-Gaussian (their pp. 11 and 17). For DeCovarT, the restricted simulations of bootstrap_decovart() already estimate \mathbb{E}(\mathcal{D}), so the Bartlett factor costs no extra fit, and likelihoodAsy::rstar() needs only the log-likelihood and simulate_bulk_mixture(). Neither correction applies at a face, where the problem is not regular (Sec. 4.3). The Cox–Reid adjustment of Eq. 16 is the third higher-order device, aimed at the nuisance parameters rather than at the tail of the statistic.
Firth penalisation and finite-sample corrections
Two finite-sample problems remain: the O(N^{-1}) bias of the MLE (Sec. 1.5), and estimates that run to a face because the likelihood is flat there. Firth’s adjustment addresses both. It maximises
\ell_{\mathrm{F}}(\boldsymbol{\vartheta})=\ell(\boldsymbol{\vartheta})+\tfrac12\log\det I(\boldsymbol{\vartheta}) (Firth 1993). With the general Fisher information the adjusted score is
\frac{\partial\ell_{\mathrm{F}}}{\partial\vartheta_q} =\frac{\partial\ell}{\partial\vartheta_q} +\tfrac12\,\mathrm{tr}\Bigl(I(\boldsymbol{\vartheta})^{-1}\frac{\partial I(\boldsymbol{\vartheta})}{\partial\vartheta_q}\Bigr). \tag{17}
For the cell-count model of independent cells, linear covariance the information depends on \boldsymbol{m} only through \boldsymbol{\Omega}, and \partial\boldsymbol{\Omega}/\partial m_q=-\boldsymbol{\Omega}\boldsymbol{\Sigma}_{W,q}\boldsymbol{\Omega}, so
\frac{\partial I(\boldsymbol{m})_{kl}}{\partial m_q} =-\boldsymbol{\mu}_{\cdot k}^{\top}\boldsymbol{\Omega}\boldsymbol{\Sigma}_{W,q}\boldsymbol{\Omega}\boldsymbol{\mu}_{\cdot l} -\mathrm{tr}\bigl(\boldsymbol{\Omega}\boldsymbol{\Sigma}_{W,k}\boldsymbol{\Omega}\boldsymbol{\Sigma}_{W,q}\boldsymbol{\Omega}\boldsymbol{\Sigma}_{W,l}\bigr), \tag{18}
where the two trace terms of the product rule coincide by transposition and cyclicity. Both summands are negative semidefinite contributions: information about counts decreases as counts grow, because more cells inflate \boldsymbol{S}_W(\boldsymbol{m}) and deflate \boldsymbol{\Omega}. Jeffreys’ prior \sqrt{\det I} therefore favours small totals, and the Firth penalty on the cell-count chart pulls \hat n_i downward. That is a prior statement, not a proven bias reduction: Firth’s exact removal of the O(N^{-1}) term holds for the canonical parameter of a full exponential family, whereas a Gaussian whose mean and covariance both depend on \boldsymbol{\vartheta} is a curved family, where the Jeffreys penalty is one of several bias-reducing modified scores and does not cancel the first-order bias exactly. On the simplex chart of Strategy 2 the same derivative applies to the \boldsymbol{p} block with the scales c_i and \phi_i fixed, and the collapse of \det I near faces and under collinear signatures is the regularising effect already argued in the perspectives vignette. A simulation under the ADEMP template of the synthetic-scenarios vignette is the only way to decide whether the pull is a correction or a bias.
DECALS corrects a different estimator. Its moment regression estimates the type-level covariances from residuals computed with \hat{\boldsymbol{\pi}}_i instead of \boldsymbol{\pi}_i, and the finite-sample gap between \hat{\boldsymbol{H}}=[\hat\pi_{ik}^{2}] and \boldsymbol{H}=[\pi_{ik}^{2}] deflates the estimated covariance and the coverage of its intervals. Proposition 1 of Cai et al. (2024) quantifies \mathbb{E}[\hat{\boldsymbol{H}}^{\top}\hat{\boldsymbol{H}}-\boldsymbol{H}^{\top}\boldsymbol{H}] and \mathbb{E}[\hat{\boldsymbol{H}}-\boldsymbol{H}] in terms of the asymptotic covariance V_i of \hat{\boldsymbol{\pi}}_i and subtracts them (their equation 7). The DeCovarT analogue is the plug-in of estimated covariances. If \hat{\boldsymbol{\Sigma}}_{W,j} is the sample covariance of C_j Gaussian cells, \nu_j=C_j-1, then \mathbb{E}[\hat{\boldsymbol{\Sigma}}_{W,j}^{-1}]=\tfrac{\nu_j}{\nu_j-G-1}\boldsymbol{\Sigma}_{W,j}^{-1} for \nu_j>G+1: the plug-in precision is inflated by a factor that is far from one for rare types with few cells and many genes. The first-order correction multiplies \hat{\boldsymbol{\Omega}}_{W,j} by (\nu_j-G-1)/\nu_j; the graphical-lasso shrinkage of the reproducibility book is the regularised alternative when \nu_j\le G+1. The two corrections are complementary: Firth acts on the likelihood geometry of the composition, the Wishart or DECALS correction acts on the covariance that the likelihood plugs in. A DECALS-style iteration, alternating between \hat{\boldsymbol{p}}_{\cdot i} and a bias-corrected \hat{\boldsymbol{\Sigma}}_{B,j} regressed on \hat p_{ji}^{2} across N bulk samples, is the route to a between-population covariance when the reference has a single replicate.
In the \boldsymbol{\rho} chart the penalty has a further effect. The information I_{\boldsymbol{\rho}}=\mathbf{J}_{\boldsymbol{\psi}}^{\top}I(\boldsymbol{p})\mathbf{J}_{\boldsymbol{\psi}} inherits the factor \mathbf{S}(\boldsymbol{p}), whose determinant tends to zero as any p_j\to 0, so \tfrac12\log\det I_{\boldsymbol{\rho}}\to-\infty at the faces. The penalised estimate is therefore always finite in \boldsymbol{\rho}, and Wald-type intervals around it are always defined (our remark; the effect on coverage has to be checked by simulation). The penalty is the log of the Jeffreys prior, so the penalised estimate is also a posterior mode (Bayesian vignette).
Both models implement the penalty. fit_firth_decovart() adds \tfrac12\log\det I_{\boldsymbol{\rho}} with the expected information, and fit_firth_single_cell() uses the observed information of the profile log-likelihood, with the two scales concentrated out. confint_decovart(method = "firth") and confint_single_cell(method = "firth") report a Wald interval at the penalised estimate, and map it through the inverse chart as well.
The sandwich for a misspecified convolution
If the Gaussian convolution is wrong in its variance, for example because counts are overdispersed or the reference covariance is mis-estimated, the inverse information understates the variance of \hat{\boldsymbol{\rho}}. The Godambe sandwich \boldsymbol{H}^{-1}\boldsymbol{K}\boldsymbol{H}^{-1}, with \boldsymbol{H} the negative Hessian and \boldsymbol{K} the variance of the score, corrects this; RNA-Sieve uses it by default (Erdmann-Pham et al. 2021). Its difficulty here is \boldsymbol{K}: one bulk column gives one score vector.
A construction that works with one column (our proposal, not implemented) uses the sequential factorisation of the Gaussian likelihood. With the Cholesky factor \boldsymbol{L}(\boldsymbol{p}) of \boldsymbol{\Sigma}(\boldsymbol{p}) and \boldsymbol{e}=\boldsymbol{L}^{-1}(\boldsymbol{y}-\boldsymbol{\mu}\boldsymbol{p}),
\ell(\boldsymbol{\rho})=\sum_{g=1}^{G}\ell_g(\boldsymbol{\rho}), \qquad \ell_g=-\log L_{gg}-\tfrac12e_g^{2}, \tag{19}
where \ell_g is the log-density of y_g given y_1,\ldots,y_{g-1}. Under the model the scores \nabla\ell_g are martingale differences, so \hat{\boldsymbol{K}}=\sum_g\nabla\ell_g\nabla\ell_g^{\top} estimates the score variance without assuming independent genes. Two limits apply: the decomposition depends on the gene order when the model is wrong, and G contributions to a (J-1)\times(J-1) matrix are few when G is small. Combined with Firth’s penalty, the robust variance of the penalised estimate is \boldsymbol{H}_{\mathrm{F}}^{-1}\hat{\boldsymbol{K}}\boldsymbol{H}_{\mathrm{F}}^{-1}.
What conformal calibration can certify
Burakov’s chapter on logistic regression (PDF) proposes split-conformal intervals for a fitted probability, with the Pearson residual r_i=(y_i-\hat p_i)/\sqrt{\hat p_i(1-\hat p_i)} as nonconformity score: fit on training data, take the (1-\alpha) quantile q of |r_i| on a calibration set, and report \hat p\pm q\sqrt{\hat p(1-\hat p)}, clipped to [0,1] (chapter 2 of Burakov, Logistic Regression: From Maximum Likelihood to Machine Learning, an external resource, not a bibliographic entry). Split-conformal theory guarantees marginal, finite-sample coverage of the observed label under exchangeability. Here |r|\le q is exactly the event that y falls in the interval, which the chapter itself calls an inappropriate target for a probability; nothing in the construction guarantees coverage of the true probability.
The same distinction decides what conformal calibration can do for DeCovarT, whose target is a parameter, \boldsymbol{p}, not a prediction.
- Gene-level Pearson residuals z=\boldsymbol{L}^{-1}(\boldsymbol{y}-\boldsymbol{\mu}\hat{\boldsymbol{p}}) calibrate predictions of expression. Genes are not exchangeable, being correlated by design, so no conformal guarantee follows. They remain a useful dispersion check: \hat\phi=\lVert\boldsymbol{z}\rVert^{2}/(G-J+1) well above one signals that the information understates the variance, and inflating I_{\boldsymbol{\rho}}^{-1} by \hat\phi is the quasi-likelihood correction of Sec. 6.
- Calibrating \boldsymbol{p} itself needs calibration bulks with known composition, such as pseudo-bulks built from held-out cells. With the score s=(\hat{\boldsymbol{\rho}}-\boldsymbol{\rho})^{\top}\hat{\boldsymbol{V}}^{-1}(\hat{\boldsymbol{\rho}}-\boldsymbol{\rho}) and the \lceil(n+1)(1-\alpha)\rceil-th smallest calibration score as threshold, the ellipsoid \{s\le q\} mapped through \boldsymbol{\psi} is a region inside the simplex with finite-sample marginal coverage, averaged over the pseudo-bulk generator. It says nothing about one given sample, and nothing about real bulk samples that the generator does not mimic, which cannot be checked because real bulk samples have no labels.
Likelihood-ratio, boundary and resampling inference
Where the estimate sits decides the null distribution
The admissible set is a polytope, and a composition can sit in its interior or on a stratum of its boundary. With J=4 cell types \Delta^{3} is a tetrahedron whose strata are the interior, four triangular faces, six edges and four vertices, corresponding to q=0,1,2 or 3 proportions equal to zero (Figure 1).
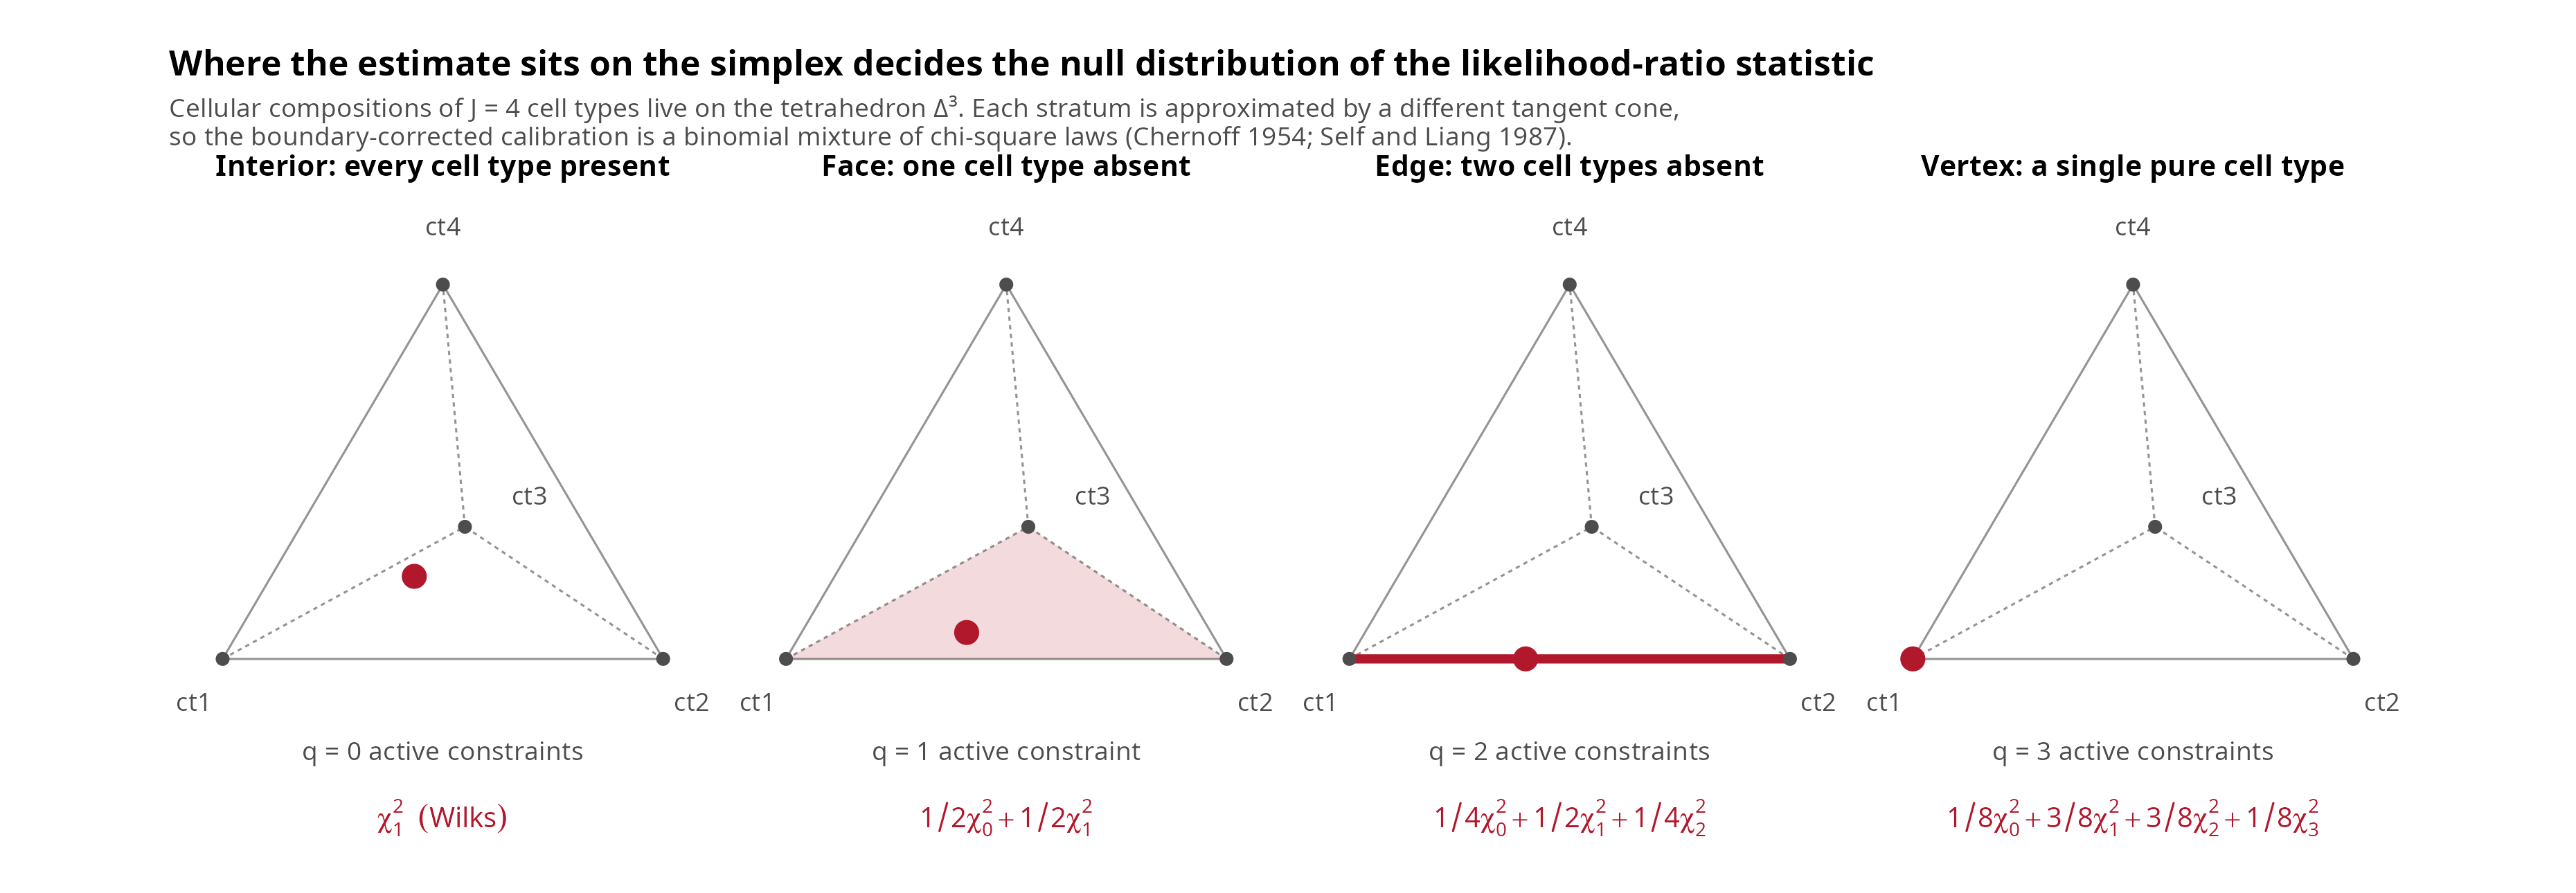
ct3. Below each panel, q counts the constraints active at the estimate and the red expression is the resulting null law of the likelihood-ratio statistic: the ordinary \chi^2_1 of Wilks (1938) in the interior, and binomially weighted chi-square mixtures on the boundary strata (Chernoff 1954; Self and Liang 1987).
The reason the calibration changes is geometric. Self and Liang (1987) show that the boundary problem is asymptotically equivalent to estimating the restricted mean of a single multivariate Gaussian draw: the limiting law of the normalised MLE is the distribution of the projection of a Gaussian score onto the tangent cone that approximates the admissible set at \boldsymbol{p}_0. In the interior that cone is the whole of \mathbb{R}^{J-1} and the projection is the identity, recovering classical theory; at a face it is a half-space, at an edge a two-dimensional wedge, and at a vertex a simplicial cone. A visual introduction to tangent and normal cones is available in these ESIEE optimisation notes.
Interior nulls: Wald and profile likelihood
For an interior null H_0:p_j=c with 0<c<1, two statistics are available.
The Wald statistic is the cheap one: (\hat{p}_j-c)/\mathrm{SE}_j with \mathrm{SE}_j the delta-method standard error of vcov_ilr_delta(), giving the symmetric interval of confint.decovart_fit(). It costs one matrix inversion, but it linearises the isometric log-ratio chart at \hat{\boldsymbol{p}} (Oehlert 1992) and is therefore not invariant to reparametrisation and can place limits outside [0,1].
The Wald statistic also fails non-monotonically near a boundary. As the estimate moves away from the null, the statistic can shrink towards zero, which is the Hauck–Donner effect (Yee 2022). The effect corresponds to estimates near the boundary of the parameter space, and Yee (2022) shows it is detected by comparing pairwise ratios of Wald, score and likelihood-ratio statistics. So a large p-value from a near-simplex-vertex Wald test can be an artefact, not evidence for the null. Use the profile likelihood-ratio statistic below in that regime.
The profile likelihood-ratio statistic
D_j(c) = 2\bigl\{ \ell(\hat{\boldsymbol{p}}) - \max_{\boldsymbol{p}\in\Delta^{J-1},\,p_j=c}\ell(\boldsymbol{p}) \bigr\} \ \rightsquigarrow\ \chi^{2}_{1} \tag{20}
concentrates out the other J-2 proportions instead. Because a smooth bijection leaves likelihood ratios unchanged, Eq. 20 needs no delta method and respects the simplex automatically. Inverting it gives the asymmetric intervals of confint_profile_decovart().
signature <- matrix(
  c(20, 40, 15, 40, 20, 25, 25, 30, 35),
  nrow = 3,
  dimnames = list(paste0("gene_", 1:3), paste0("ct", 1:3))
)
Sigma <- array(
  0,
  dim = c(3, 3, 3),
  dimnames = list(
    rownames(signature),
    rownames(signature),
    colnames(signature)
  )
)
for (j in 1:3) {
  Sigma[, , j] <- diag(3) * c(1, 1.5, 1.2)[j]
}

# Eight technical replicates of ONE composition, so the asymptotics of
# Sec. 2.4 are taken in a meaningful direction.
set.seed(11)
replicates <- simulate_bulk_mixture(
  signature_matrix = signature,
  Sigma = Sigma,
  p = c(0.45, 0.35, 0.20),
  n = 8
)$Y

round(
  confint_profile_decovart(
    y = replicates,
    mean_signature_matrix = signature,
    Sigma = Sigma
  ),
  4
)
#>     estimate  lower  upper
#> ct1   0.4531 0.4333 0.4733
#> ct2   0.3525 0.3306 0.3751
#> ct3   0.1943 0.1647 0.2229
lrt_decovart(
  y = replicates,
  mean_signature_matrix = signature,
  Sigma = Sigma,
  null_value = c(ct1 = 0.30)
)
#>     statistic n_boundary df_interior      p_value loglik_full loglik_null
#> ct1  231.2985          0           1 3.105728e-52  -0.8767418    -116.526
#>            calibration
#> ct1 chi-square (Wilks)
Boundary nulls: chi-bar-square mixtures
The scientifically interesting null is usually absence: H_0:p_j=0 against H_1:p_j\ge 0. Here the parameter may move away from the null in one direction only, so the local parameter space is a half-line rather than a vector space, and Wilks’ theorem does not apply.
Theorem 2 (Boundary calibration)
With q constraints active on the boundary and t interior constraints tested simultaneously, and the corresponding information block orthogonal to the nuisance block,
\mathcal{D} \ \rightsquigarrow\ \bar{\chi}^{2} = \sum_{u=0}^{q} \binom{q}{u}2^{-q}\, \chi^{2}_{t+u}, \tag{21}
where \chi^{2}_{0} denotes a point mass at zero (Self and Liang 1987, Case 9). For a single active constraint this is the \tfrac{1}{2}\chi^{2}_{0}+\tfrac{1}{2}\chi^{2}_{1} law of Chernoff (1954), so the correct one-sided p-value is \tfrac{1}{2}\Pr(\chi^{2}_{1}>\mathcal{D}) — half the naive value.
chi_bar_square_pvalue() evaluates Eq. 21, and lrt_decovart() selects it automatically when a tested value reaches 0 or 1.
set.seed(11)
replicates_absent <- simulate_bulk_mixture(
  signature_matrix = signature,
  Sigma = Sigma,
  p = c(0.5, 0.5, 0),
  n = 8
)$Y

lrt_decovart(
  y = replicates_absent,
  mean_signature_matrix = signature,
  Sigma = Sigma,
  null_value = c(ct3 = 0)
)
#>     statistic n_boundary df_interior p_value loglik_full loglik_null
#> ct3         0          1           0     0.5    -5.88388    -5.88388
#>                     calibration
#> ct3 chi-bar-square (Self-Liang)
Warning 4: Three caveats on Eq. 21
- Binomial weights are conditional. They require the active block of the information matrix to be orthogonal to the nuisance block. When several absent cell types share signal, the mixing weights depend on the geometry of the tangent cone; Self and Liang (1987) exhibit a configuration (their Case 8, a nuisance parameter on the boundary) whose limit is not a chi-square mixture at all. Pass explicit
weights, or calibrate by simulation (Sec. 4.5).- Do not encode the null in ILR coordinates. p_j=0 corresponds to an infinite log-ratio, so the chart cannot represent the hypothesis. The restricted fits substitute the constrained value directly.
- Wald is unusable here. The delta-method covariance is undefined on the face, and the Hauck–Donner effect (Yee 2022) makes its test unreliable as the estimate approaches it;
vcov_ilr_delta()returnsNAwith a warning rather than a plausible-looking number.
Replication is what makes the asymptotics meaningful
Eq. 20 and Eq. 21 are limits as the amount of information about one composition grows. That is a strong requirement in deconvolution, and it is the same N\to\infty that turns the O(N^{-1}) bias of Sec. 1.5 into consistency.
For each bulk sample i, DeCovarT observes a single G-vector \boldsymbol{Y}_{\cdot i}\sim\mathcal{N}_G(\boldsymbol{\mu} \boldsymbol{p}_{\cdot i},\boldsymbol{\Sigma}(\boldsymbol{p}_{\cdot i})) and estimates its own \boldsymbol{p}_{\cdot i}. Increasing the number of samples N therefore adds parameters exactly as fast as observations, and provides no extra replication for any single \boldsymbol{p}_{\cdot i}. The G genes are not G independent observations either: their dependence through \boldsymbol{\Sigma}(\boldsymbol{p}) is the whole point of the model.
Important 5: Per-sample intervals are plug-in approximations
The default per-sample
vcovandconfintof adecovart_fitare one-observation plug-in quantities. Treat them as descriptive curvature summaries, not as calibrated frequentist intervals.Two things restore the asymptotics, and both are implemented:
- Pool genuine replicates. Supply several bulk columns that really do share one composition (technical replicates, or aliquots of one tissue) as the columns of the
ymatrix oflrt_decovart()/confint_profile_decovart(). Those functions maximise the summed log-likelihood over the replicates, so the limit is taken in the number of replicates.- Simulate instead of appealing to a limit (Sec. 4.5).
Reference uncertainty is a third, separate gap: \boldsymbol{\mu} and \boldsymbol{\Sigma}_j are plug-in estimates from purified populations, and none of the intervals above propagate their sampling variability.
reference_bootstrap_decovart()resamples those profiles (Sec. 4.6); see Vellame et al. (2023) for the analogous accuracy metric in methylation deconvolution.
Parametric bootstrap calibration
The conditional law of the bulk profile is fully specified, so the asymptotic mixture can be replaced by simulation. bootstrap_decovart() draws \boldsymbol{Y}^{(b)}\sim\mathcal{N}_G(\boldsymbol{\mu}\boldsymbol{p},
\boldsymbol{\Sigma}(\boldsymbol{p})), refits, and — when null_value is supplied — regenerates under the restricted MLE so the likelihood-ratio statistic is recalibrated without invoking the 50{:}50 weights (Roch 2024 reviews the concentration tools behind such Monte Carlo guarantees).
The atom at zero is directly observable: under a true boundary null, about half of the replicates should return \mathcal{D}=0, because the unrestricted MLE itself falls on the face.
set.seed(5)
calibration <- bootstrap_decovart(
  y = replicates_absent,
  mean_signature_matrix = signature,
  Sigma = Sigma,
  null_value = c(ct3 = 0),
  n_boot = 150
)
c(
  observed_statistic = calibration$statistic,
  monte_carlo_p = calibration$p_value,
  share_of_zero_statistics = mean(calibration$null_statistics < 1e-8),
  asymptotic_p = chi_bar_square_pvalue(
    calibration$statistic,
    n_boundary = 1L
  )
)
#>       observed_statistic            monte_carlo_p share_of_zero_statistics
#>                0.0000000                1.0000000                0.4666667
#>             asymptotic_p
#>                0.5000000
The observed share of zero statistics is the empirical counterpart of the \tfrac{1}{2}\chi^{2}_{0} atom in Eq. 21. A restricted bootstrap is still only approximate for a composite null, because the nuisance proportions are held at their restricted estimates rather than profiled over; it is exact only when \boldsymbol{p}_0 is fully specified.
Reference-sample bootstrap
bootstrap_decovart() treats \boldsymbol{\mu} and \boldsymbol{\Sigma}_j as known. They are not: both are estimated from purified profiles. reference_bootstrap_decovart() resamples the experimental units of that labelled reference, rebuilds the plug-in moments, and refits, so reference uncertainty appears in the percentile intervals (Efron 1979). Cell-type names stay attached throughout. The two method options are:
-
donors(default). Cluster bootstrap of donors within each cell type. A donor drawn twice contributes its purified columns twice. This is the favoured option when donor labels exist: it captures biological variation in the reference population rather than treating cells from one individual as independent. -
cells. Column resampling within each cell type, for when donor labels are unavailable.1
Both options draw with replacement, which makes them bootstraps. A permutation (Monte Carlo randomisation) test draws without replacement: it shuffles labels to build the distribution of a statistic under a null of exchangeability, and serves hypothesis testing rather than interval estimation. Shuffling cell-type labels is vacuous here, because the likelihood is equivariant under relabelling (equivariance_check_decovart() below).
By default the observed bulk is held fixed (reference uncertainty for a given mixture). Setting regenerate_bulk = TRUE follows the fuller pipeline \text{reference units}\to S^{(b)}\to Y^{(b)}\to\hat{\boldsymbol{p}}^{(b)}.
A related design point for simulation studies, not implemented as an argument here, is to split reference-building cells from pseudobulk-generating cells, ideally at the donor level. Using the same cells, or cells from the same individual, in both the signature and the artificial bulk makes a benchmark unrealistically easy (Sturm et al. 2019; Avila Cobos et al. 2020; Zhao et al. 2026). Nguyen et al. (2024) review 53 bulk methods and stress incomplete references and missing cell types; Avila Cobos et al. (2020) show that omitted types and the expression scale dominate error on pseudobulk mixtures. The simulation generator used to evaluate imply is a useful reference-based template: cell-type parameters are drawn from a multivariate Gaussian, purified-like expression is realised from a Gamma (negative-binomial-like) law fitted to RNA-seq counts, and bulk mixtures are then formed from those profiles with Dirichlet compositions (Meng et al. 2024). That is distinct from DeCovarT’s Gaussian convolution of the bulk; it is a design for how to build a labelled S and a synthetic Y with known p.
set.seed(9)
refs <- lapply(seq_len(ncol(signature)), function(j) {
  draws <- MASS::mvrnorm(
    n = 12L,
    mu = signature[, j],
    Sigma = Sigma[, , j]
  )
  out <- t(draws)
  rownames(out) <- rownames(signature)
  out
})
names(refs) <- colnames(signature)
donor_ids <- lapply(refs, function(x) {
  rep(paste0("d", 1:3), length.out = ncol(x))
})
ref_boot <- reference_bootstrap_decovart(
  y = replicates,
  reference_profiles = refs,
  donor_ids = donor_ids,
  method = "donors",
  n_boot = 40,
  itmax = 80
)
ref_boot$interval
#>          2.5%     97.5%
#> ct1 0.4368080 0.4605851
#> ct2 0.3336731 0.3614464
#> ct3 0.1866613 0.2235220
equivariance_check_decovart() is a software check of label equivariance: permute the signature columns, refit, and confirm that \hat{\boldsymbol{p}} merely relabels. It is not the distribution used for confidence intervals.
eq_check <- equivariance_check_decovart(
  y = replicates[, 1],
  mean_signature_matrix = signature,
  Sigma = Sigma,
  perm = c(3L, 1L, 2L),
  itmax = 80
)
c(
  max_abs_diff = eq_check$max_abs_diff,
  loglik_diff = eq_check$loglik_diff
)
#> max_abs_diff  loglik_diff
#> 1.110223e-16 2.220446e-16
RNA-Sieve: CLT likelihood, Fisher and Godambe
RNA-Sieve (Erdmann-Pham et al. 2021), with its gene-wise central-limit likelihood, its errors-in-variables reference and its Fisher and Godambe intervals, is compared with DeCovarT in the distribution-aware deconvolution review.
Convergence and boundary diagnostics
Because Note 1 rules out global guarantees, a single optimiser return code carries less information than it appears to. fit_decovart() therefore records three logically distinct claims, and refuses to conflate them:
| Field | Established by | Does not establish |
|---|---|---|
converged (iterations, criterion, code, rdm) |
numerical stopping rules met (iterative solvers; NA for NNLS / LSEI / CIBERSORT) |
that the point is a maximum |
local_maximum (small ILR score, \lambda_{\min}(H_z)<0 and \lambda_{\max}(H_z)<0) |
stationarity with a negative-definite Hessian | global optimality |
near_boundary (\min_j\hat{p}_j small) |
proximity to a simplex face | optimiser failure |
multimodal (spread of log-likelihoods over random starts) |
evidence for several modes | absence of further modes |
boundary_diagnostics() computes the first three per sample; they are stored in fit$diagnostics.
fit <- fit_decovart(
  signature_matrix = signature,
  bulk_expression = replicates[, 1:3],
  Sigma = Sigma,
  itmax = 100
)
do.call(rbind, fit$diagnostics)
#>          boundary_distance near_boundary   score_norm min_eigenvalue
#> sample_1         0.1667117         FALSE 6.028243e-06      -170.4695
#> sample_2         0.2410455         FALSE 6.294137e-05      -154.9372
#> sample_3         0.2110584         FALSE 1.500411e-04      -162.5574
#>          max_eigenvalue local_maximum
#> sample_1      -15.95316          TRUE
#> sample_2      -29.56308          TRUE
#> sample_3      -23.72404         FALSE
Every sample above converged and every curvature is negative, yet local_maximum is not uniformly TRUE: one iterate stopped with an ILR score norm just above the default score_tol = 1e-4. That is the distinction of Table 2 doing its job rather than a failure — score_tol bounds the score, whereas the solver’s epsilon bounds the objective, so the two should be tightened together.
Note 6: Near-boundary is not failure
Suppose the truth is \boldsymbol{p}_0=(0,0.3,0.7). A fit returning \hat{\boldsymbol{p}}=(10^{-10},0.3001,0.6999) is numerically excellent: the optimiser is correctly approaching a genuine boundary optimum, and an interior ILR solver cannot settle at a finite \boldsymbol{z} there. So \min_j\hat{p}_j\ll 1 should not be read as “optimisation failed” but as
the estimate is close to a simplex face, so ILR coordinates and interior Wald inference may be unreliable.
boundary_tolis therefore a statistical warning threshold for Wald linearisation, deliberately far larger than the machine-precision guard that decides whether a logarithm is representable. The two serve different purposes and should not share a value.
Multimodality is the one property that restarts address directly. multistart_decovart() refits from independent Dirichlet(1,\ldots,1) starts and reports the spread of attained optima; fit_decovart(n_starts = ) wires it into the S3 workflow and keeps the best mode.
set.seed(3)
restarts <- multistart_decovart(
  y = replicates[, 1],
  mean_signature_matrix = signature,
  Sigma = Sigma,
  n_starts = 6L,
  itmax = 100
)
c(
  loglik_range = restarts$loglik_range,
  multimodal = restarts$multimodal
)
#> loglik_range   multimodal
#>  2.37166e-09  0.00000e+00
A small range is reassuring but not a proof: a converged code, a tiny relative-distance-to-minimum and a negative-definite local Hessian together support a local maximum, and none of them rules out a second, equally good or better mode elsewhere on the simplex.
A generalised linear model view of DeCovarT
Transforming the response versus modelling its mean
A generalised linear model has three parts: a distribution with a variance function V(\mu), a linear predictor, and a link g applied to the conditional mean, g\{\mathbb{E}(y\mid\boldsymbol{x})\}=\boldsymbol{x}^{\top}\boldsymbol{\beta}. Agresti contrasts this with transforming the response and fitting a Gaussian linear model to f(y) (Agresti 2015, Sec. 1.1.6). Read for deconvolution, the contrast has five parts.
- A transformation changes the estimand. For a convex f, f\{\mathbb{E}(y)\}\le\mathbb{E}\{f(y)\} (Jensen), with equality only when f is affine. A mean computed on \log y and exponentiated is a geometric mean, not \mathbb{E}(y). The link applies to the mean itself, so g^{-1} of the fitted predictor is the fitted mean on the original scale. Only quantiles travel back through a monotone transformation.
- One transformation cannot do three jobs. It would have to make the mean linear, the variance constant and the error Gaussian at the same time. A GLM gives each job its own part: the link for the mean, the variance function for the spread, the distribution for the shape.
- The mean–variance relationship belongs in the model. A variance-stabilising transformation removes it from the data with a fixed function chosen in advance. A GLM keeps it and weights each observation by 1/V(\hat\mu) at the current fit, updated as the fit changes (iteratively reweighted least squares).
- Support. A logarithm needs positive data; \log(y+c) is a third response whose meaning depends on c, and the zeros it was meant to handle are still in the data, now hidden.
- Additivity. The bulk is a physical sum of cells, so its mean is linear in the composition on the linear scale, \mathbb{E}(\boldsymbol{y})=\boldsymbol{\mu}\boldsymbol{p}. On logarithms, \log(\boldsymbol{\mu}\boldsymbol{p})\neq(\log\boldsymbol{\mu})\boldsymbol{p}: a model linear in \boldsymbol{p} on log data mixes logarithms, which no tissue does (equivariance).
DeCovarT already follows the GLM pattern in one respect: the link on the mixing scale is the identity, because the physics is additive, and the constraint is handled by an inverse link on the parameter, \boldsymbol{p}=\boldsymbol{\psi}(\boldsymbol{\rho}) (parametrisation). What the released model lacks is the variance function of the measurement (Sec. 6.3).
A counter-example: transforming the data to look Gaussian
DeOPUS estimates proportions by minimising \sum_g\{\mathcal{T}(\boldsymbol{b})_g-\mathcal{T}(\mathbf{C}\boldsymbol{p})_g\}^{2} with uniform gene weights, where \mathcal{T} is a deterministic map applied to both the bulk \boldsymbol{b} and the reconstruction \mathbf{C}\boldsymbol{p}: a power transformation with fixed shrinkage factors, a rank-based quantile normalisation that maps “all expression vectors to approximate Gaussian scores”, a blend of the two, and a soft clipping. The authors present \mathcal{T} as variance stabilising, providing “implicit variance stabilization without the need for explicit gene-specific noise estimation” (Nguyen et al. 2026).
To its credit, transforming both sides keeps the mixture linear on the raw scale; the mixture is not logged. The problems are the ones of Sec. 6.1, applied to the variance.
- The variance model is fixed in advance. For a smooth gene-wise h, \sum_g\{h(y_g)-h(m_g)\}^{2}\approx\sum_gh'(m_g)^{2}(y_g-m_g)^{2}, a weighted least-squares fit with weights h'(m)^{2} dictated by the chosen functional form. A model with a Poisson measurement estimates the weights 1/V(m)=1/m from the measurement process itself.
- The map is not gene-wise. Sums, ranks and maxima over the whole sample enter \mathcal{T}, so one gene’s contribution depends on all the others, and rank scores are piecewise constant in \boldsymbol{p}.
- There is no likelihood. Without a model for \boldsymbol{b} there is no information matrix and no interval; the authors list uncertainty quantification as future work.
The aim, data that look Gaussian with a constant variance, is the transformation route. A variance function derived from the measurement model reaches the same weighting, keeps the mean on its scale, and comes with inference.
DeCovarT as a multivariate quasi-likelihood model
Write the single-cell-tailored DeCovarT (single-cell generative vignette) in GLM terms, for one bulk sample with mean scale c=a n, covariance scale \phi=a^{2}n and raw per-cell means \tilde{\boldsymbol{\mu}}:
\mathbb{E}(\boldsymbol{y}\mid\boldsymbol{\rho})=\boldsymbol{\mu}_{y}(\boldsymbol{\rho})=c\,\tilde{\boldsymbol{\mu}}\,\boldsymbol{\psi}(\boldsymbol{\rho}), \qquad \operatorname{Cov}(\boldsymbol{y}\mid\boldsymbol{\rho})=\boldsymbol{\Sigma}_{y}(\boldsymbol{\rho}) =\phi\,\boldsymbol{S}_W(\boldsymbol{p})+c^{2}\boldsymbol{S}_B(\boldsymbol{p})+\omega\operatorname{diag}\{\boldsymbol{\mu}_{y}(\boldsymbol{\rho})\}. \tag{22}
The mean is the systematic component: identity on the mixing scale, inverse link \boldsymbol{\psi} on the composition. The covariance is the variance function, and each term comes from a model rather than from a transformation: independent cells (linear weight), shared population fluctuations (quadratic weight, needs replicates), and the Poisson measurement of the bulk with a dispersion \omega (variance equal to the mean when \omega=1). Without \boldsymbol{S}_B and given \boldsymbol{p}, the mean fixes c, so the Poisson term adds no parameter; a free \omega is identified from one bulk sample if and only if the denoised \boldsymbol{S}_W(\boldsymbol{p}) is not a multiple of \operatorname{diag}(\tilde{\boldsymbol{\mu}}\boldsymbol{p}). The final model of Sec. 6.4 keeps only the first term, \boldsymbol{\Sigma}_{y}(\boldsymbol{\rho})=\phi\boldsymbol{S}_W(\boldsymbol{\psi}(\boldsymbol{\rho})): a known variance function times a dispersion, as in a quasi-likelihood GLM. With a raw \boldsymbol{S}_W this term contains the bulk Poisson diagonal exactly when a=\phi/c=1.
Two estimators share Eq. 22.
- Gaussian likelihood with this mean and covariance, as released DeCovarT does for its own covariance. It uses the dependence of \boldsymbol{\Sigma}_{y} on \boldsymbol{\rho} (the determinant and covariance terms of the score), which adds information when the Gaussian shape holds.
- Quasi-score, \mathbf{J}_{\boldsymbol{\mu}_y}^{\top}\boldsymbol{\Sigma}_{y}^{-1}\{\boldsymbol{y}-\boldsymbol{\mu}_{y}(\boldsymbol{\rho})\}=\boldsymbol{0} with \mathbf{J}_{\boldsymbol{\mu}_y}=\partial\boldsymbol{\mu}_{y}/\partial\boldsymbol{\rho}^{\top}=c\tilde{\boldsymbol{\mu}}\mathbf{J}_{\boldsymbol{\psi}}. It needs only the first two moments, its information is \mathbf{J}_{\boldsymbol{\mu}_y}^{\top}\boldsymbol{\Sigma}_{y}^{-1}\mathbf{J}_{\boldsymbol{\mu}_y} (the mean part of the Fisher information), and the sandwich of Sec. 3.9 keeps it valid when \boldsymbol{\Sigma}_{y} is misspecified. With \boldsymbol{\Sigma}_{y}=\phi\boldsymbol{S}_W, the dispersion cancels from the quasi-score and is estimated after the fit from the Pearson statistic, \hat\phi=\lVert\boldsymbol{L}^{-1}(\boldsymbol{y}-\hat{\boldsymbol{\mu}}_{y})\rVert^{2}/(G-J), with \boldsymbol{L} the Cholesky factor of \boldsymbol{S}_W(\hat{\boldsymbol{p}}) and J free mean parameters (J-1 ILR coordinates and c).
Across samples. With several bulk samples and covariates \boldsymbol{f}_i, MEAD models the composition itself as a GLM, \mathbb{E}(\boldsymbol{p}_{\cdot i})=h(\boldsymbol{b}_0+\boldsymbol{A}_0^{\top}\boldsymbol{f}_i) with h the identity or the softmax, fitted by the estimating equation \frac1N\sum_i\{\hat{\boldsymbol{p}}_{1:(J-1),i}-h(\boldsymbol{b}+\boldsymbol{A}^{\top}\boldsymbol{f}_i)_{1:(J-1)}\}\tilde{\boldsymbol{f}}_i^{\top}=\boldsymbol{0} with \tilde{\boldsymbol{f}}_i=(1,\boldsymbol{f}_i) and a sandwich variance (Xie et al. 2026). Plugging in estimated proportions is valid when N=o(G); when the number of samples approaches the number of genes, estimation errors accumulate, and the reported coverage of group differences falls from 0.93 with 86 samples to 0.81 with 1000. The transformation trap reappears at this level: regressing the ILR coordinates \hat{\boldsymbol{\rho}}_i linearly on \boldsymbol{f}_i targets \mathbb{E}(\operatorname{ilr}\boldsymbol{p}), not \operatorname{ilr}\mathbb{E}(\boldsymbol{p}).
The final choice for real data
The constraints of the intended application are: one single-cell reference from one donor (R=1) counted with UMIs; one bulk sample at a time, with no covariates and no paired cohort; and no gene-wise platform ratio within the UMI platform. Under them, the recommended model is Eq. 22 reduced to what one donor and one bulk sample identify:
\boldsymbol{y}_{\cdot i}\mid\boldsymbol{p}_{\cdot i} \sim\mathcal{N}_G\Bigl( a_in_i\tilde{\boldsymbol{\mu}}\boldsymbol{p}_{\cdot i},\; a_i^{2}n_i\sum_jp_{ji}\boldsymbol{\Sigma}_{W,j} \Bigr), \qquad \boldsymbol{p}_{\cdot i}=\boldsymbol{\psi}(\boldsymbol{\rho}_i). \tag{23}
Equivalently \boldsymbol{y}_{\cdot i}=a_in_i\tilde{\boldsymbol{y}}_{\cdot i} with \tilde{\boldsymbol{y}}_{\cdot i}\sim\mathcal{N}_G\bigl(\tilde{\boldsymbol{\mu}}\boldsymbol{p}_{\cdot i},n_i^{-1}\boldsymbol{S}_W(\boldsymbol{p}_{\cdot i})\bigr). Each term is a choice with a reason.
- Raw per-cell means, cell fractions directly. The columns of \tilde{\boldsymbol{\mu}} are per-cell means of raw UMI counts, \tilde{\boldsymbol{\mu}}_{\cdot j}=S_j\boldsymbol{\theta}_{\cdot j}, so the cell size S_j stays in the mean and the fit returns cell fractions \boldsymbol{p}_{\cdot i}. Transcript fractions follow as q_{ji}=p_{ji}S_j/\sum_\ell p_{\ell i}S_\ell (RNA versus cell fractions). A library-normalised signature \boldsymbol{\theta}_{\cdot j} would return \boldsymbol{q}_{\cdot i} and need the conversion; use one route, never both.
- Two scales, not three. The capture ratio a_i and the number of cells n_i enter only through the mean scale c_i=a_in_i and the covariance scale \phi_i=a_i^{2}n_i (global scale). At fixed \boldsymbol{\rho}_i, \hat c_i is the generalised least-squares coefficient of \boldsymbol{y}_{\cdot i} on \tilde{\boldsymbol{\mu}}\boldsymbol{p}_{\cdot i} and \hat\phi_i the mean squared Mahalanobis residual, so both are profiled out; a_i=\phi_i/c_i and n_i=c_i^{2}/\phi_i are read afterwards and are interpretable only when the bulk and the reference share the platform.
- Only the within-type covariance. One donor identifies the cell-to-cell covariance, not the between-donor one (three reference regimes). Estimate it from cells after removing the Poisson diagonal and the technical size-factor term (denoised covariance), with a sparse precision from the graphical lasso. The bulk adds its own sampling diagonal c_i\operatorname{diag}(\tilde{\boldsymbol{\mu}}\boldsymbol{p}_{\cdot i}); the raw covariance reproduces it only when the bulk depth per reference unit is a_i=1 (raw or denoised). Our remark: independent cells add with cell-count weights m_{ji}=n_ip_{ji}, so this linear covariance layer is weighted by \boldsymbol{p}_{\cdot i}, not by the transcript fractions \boldsymbol{q}_{\cdot i}.
-
No extra bulk noise parameter. For UMI-like bulk counts the Poisson diagonal c_i\operatorname{diag}(\tilde{\boldsymbol{\mu}}\boldsymbol{p}_{\cdot i}) adds no parameter: the mean fixes c_i, so (c_i,\phi_i) stays identified given \boldsymbol{p}_{\cdot i} whenever \boldsymbol{S}_W(\boldsymbol{p}_{\cdot i})\neq\boldsymbol{0}. The covariance is then no longer proportional to \phi_i: for fixed a_i=\phi_i/c_i, \hat c_i is the positive root of a quadratic, and a_i is profiled numerically in one dimension. This term is not implemented; with a raw \boldsymbol{S}_W,
deconvolute_single_cell()assumes a_i=1. A negative-binomial dispersion in front of the term is not added; one sample identifies it only if \boldsymbol{S}_W(\boldsymbol{p}_{\cdot i}) is not a multiple of \operatorname{diag}(\tilde{\boldsymbol{\mu}}\boldsymbol{p}_{\cdot i}). Misspecification of the variance is handled by the sandwich of Sec. 3.9 instead. -
No gene-wise platform ratio. With UMIs it cancels within the reference platform; between platforms it is not identified from one sample (
MEAD), so it is handled by gene selection, keeping genes detected consistently in both assays, not by estimation. -
Inference. Report the ILR back-transformation of Sec. 3.5, or the profile interval, with c_i and \phi_i profiled out (Sec. 3.6); the limit that justifies them for one bulk sample is the small-dispersion limit in the number of cells (Sec. 3.1). Switch to Firth’s penalty when a proportion approaches zero, and to the boundary likelihood-ratio test when absence is the question (Sec. 4.3). With one donor, the reference uncertainty comes from
reference_bootstrap_decovart(method = "cells").
Recap: which interval or test to report
The procedures below all target the same composition \boldsymbol{p}\in\Delta^{J-1}, but they rest on different approximations. Table 3 is the practical counterpart of the Wald warning in the population generative vignette: use the cheapest method that the geometry of the estimate actually supports.
confint.decovart_fit() remains the delta method. confint_decovart() and confint_single_cell() default to the ILR back-transformation. Rows marked “not implemented” are specified in this vignette.
| Procedure | What it returns | Calibration | Simplex faces | Replication | Function |
|---|---|---|---|---|---|
| Wald (delta method on \boldsymbol{p}) | per-sample CI, may leave [0,1] | \mathrm{N}(\boldsymbol{0},I(\hat{\boldsymbol{z}})^{-1}) mapped by \mathbf{J}_{\boldsymbol{\psi}} | unusable (NA) |
one bulk column is a plug-in approximation (Note 5) |
confint() / vcov_ilr_delta()
|
| ILR back-transformation | per-sample CI inside (0,1), jointly a composition | quantiles of \boldsymbol{\psi}(\boldsymbol{\rho}^{(b)}), \boldsymbol{\rho}^{(b)}\sim\mathcal{N}(\hat{\boldsymbol{\rho}},I_{\boldsymbol{\rho}}^{-1}) (Sec. 3.5) | undefined on a face | as Wald |
confint_decovart() (default), confint_single_cell()
|
| Score-test inversion | asymmetric CI, information at each null value | \chi^2_1 on Eq. 12 (Sec. 3.4) | defined in \boldsymbol{p} coordinates | as profile | not implemented |
| Firth-penalised Wald | per-sample CI, estimate always interior | Jeffreys-penalised likelihood (Sec. 3.8) | defined | exact bias removal only for canonical exponential families; simulation check needed here |
fit_firth_decovart(), fit_firth_single_cell()
|
| Sandwich (Godambe) | per-sample CI robust to a wrong variance | sequential score contributions (Sec. 3.9) | interior only | few genes make it noisy | not implemented |
| Profile likelihood | CI in [0,1], lower and upper limits from the signed root | Wilks \chi^2_1 on the deviance (Wilks (1938)), nuisance scales profiled out (Sec. 3.6) | stays inside the simplex; endpoints on a face need the boundary LRT | pooled replicates, or many cells per type (Sec. 3.1) | confint_profile_decovart() |
| r^{\ast} or Bartlett-corrected LRT | CI with O(n^{-3/2}) or O(n^{-2}) error | modified likelihood root, or \mathcal{D} rescaled by its bootstrap mean (Sec. 3.7) | not regular on a face | small N or few cells | not implemented (likelihoodAsy for r^{\ast}) |
| Interior LRT | test of p_j=c\in(0,1) | \chi^2_1 | not for c=0 or c=1 | same as profile | lrt_decovart() |
| Boundary LRT | test of p_j=0 | chi-bar-square \tfrac12\chi^2_0+\tfrac12\chi^2_1 (Chernoff 1954; Self and Liang 1987) | designed for this | same as profile |
lrt_decovart() (automatic) |
| Parametric bootstrap | percentile CI and Monte Carlo p-value | \boldsymbol{Y}^{(b)}\sim\mathcal{N}_G(\boldsymbol{\mu}\boldsymbol{p},\boldsymbol{\Sigma}(\boldsymbol{p})) at the MLE or restricted MLE | automatic (the \tfrac12\chi^2_0 atom is visible) | known plug-in (\boldsymbol{\mu},\boldsymbol{\Sigma}_j,\boldsymbol{p}) | bootstrap_decovart() |
| Reference-sample bootstrap | percentile CI | resample donors (default) or cells within each labelled type, with replacement, rebuild (\boldsymbol{\mu},\boldsymbol{\Sigma}_j), refit (Efron 1979) | automatic | uncertainty in the reference, not in \boldsymbol{Y} unless regenerate_bulk
|
reference_bootstrap_decovart() |
A short decision rule, in the order the table suggests abandoning the previous row:
- If \hat{\boldsymbol{p}} is interior and several bulk columns share one composition, a profile interval or an interior LRT is the reparametrisation-invariant upgrade of Wald.
- If the scientific null is absence (p_j=0), do not report Wald; use the chi-bar-square LRT or a restricted parametric bootstrap.
- If the dominant uncertainty is the purified reference, use
reference_bootstrap_decovart()withmethod = "donors"when donor labels exist, otherwisemethod = "cells". Do not permute genes or cell-type names: the likelihood is equivariant under relabelling, so a label shuffle is vacuous, and a gene shuffle is not a sampling model. Useequivariance_check_decovart()only as a software check. - If the Wald, score and likelihood-ratio intervals disagree, the log-likelihood is not quadratic (Sec. 3.2): report the profile interval, with a Bartlett or r^{\ast} correction when replicates or cells are few.
The single-cell mixture uses the same menu through confint_single_cell(). The composition interval is built from the profile information, the Schur complement that removes the scales (c,\phi). Intervals for those two scales use the complementary Schur complement. Neither interval corrects the plug-in reference covariance. The single-cell inference vignette derives that menu, with its REML calibration for few genes.
Outlook: beyond first-order asymptotics
Tip 7: Uncertainty quantification beyond Wald
Directions that would strengthen DeCovarT intervals, in rough order of implementation cost.
- Godambe sandwich for a misspecified convolution.
RNA-Sievereplaces Fisher by the Godambe information when the CLT model is wrong (Erdmann-Pham et al. 2021) (Sec. 4.7; the one-column construction is Sec. 3.9). The same sandwich on DeCovarT’s score would widen Wald intervals under protocol shift without discarding the multivariate covariance. It remains a first-order interior device: faces still need the chi-bar-square LRT or a restricted bootstrap.- Score-test inversion (Sec. 3.4). Each candidate value needs only the restricted fit, so the scan costs the same number of fits as the profile, and the score in \boldsymbol{p} coordinates stays defined on a face.
- Higher-order likelihood corrections (Sec. 3.7). The Bartlett factor from the restricted bootstrap, r^{\ast} through
likelihoodAsy, and the Cox–Reid adjusted profile of Eq. 16 target the small-replication regime of Note 5, which is DeCovarT’s regime.- Bayesian compositional models. A logistic-normal or Dirichlet prior on \boldsymbol{p} regularises the boundary: the posterior stays proper where the ILR Wald interval degenerates, and credible intervals are usually more stable near a face. A credible interval is not an exact frequentist interval, and the prior must be defensible scientifically.
References
Agresti, Alan. 2015. Foundations of Linear and Generalized Linear Models. Wiley.
Avila Cobos, Francisco, José Alquicira-Hernandez, Joseph E. Powell, Pieter Mestdagh, and Katleen De Preter. 2020. ‘Benchmarking of Cell Type Deconvolution Pipelines for Transcriptomics Data’. Nature Communications 11 (1): 5650. https://doi.org/10.1038/s41467-020-19015-1.
Boyd, Stephen, Stephen P. Boyd, and Lieven Vandenberghe. 2004. Convex Optimization. 1st edn. Cambridge University Press; Cambridge University Press. https://doi.org/10.1017/cbo9780511804441.
Cai, Biao, Emma Jingfei Zhang, Hongyu Li, Chang Su, and Hongyu Zhao. 2024. ‘Statistical Inference of Cell-Type Proportions Estimated from Bulk Expression Data’. Journal of the American Statistical Association 119 (548): 2521–32. https://doi.org/10.1080/01621459.2024.2382435.
Canonero, Enzo, Alessandra Rosalba Brazzale, and Glen Cowan. 2023. ‘Higher-Order Asymptotic Corrections and Their Application to the Gamma Variance Model’. The European Physical Journal C 83 (12): 1100. https://doi.org/10.1140/epjc/s10052-023-12263-7.
Chernoff, Herman. 1954. ‘On the Distribution of the Likelihood Ratio’. The Annals of Mathematical Statistics 25 (3): 573–78. https://doi.org/10.1214/aoms/1177728725.
Commenges, Daniel, Helene Jacqmin-Gadda, Cecile Proust, and Jeremie Guedj. 2006. A Newton-Like Algorithm for Likelihood Maximization: The Robust-Variance Scoring Algorithm. arXiv. https://doi.org/10.48550/arxiv.math/0610402.
Cox, D. R., and D. V. Hinkley. 1979. Theoretical Statistics. Chapman and Hall/CRC. https://doi.org/10.1201/b14832.
Cox, D. R., and N. Reid. 1987. ‘Parameter Orthogonality and Approximate Conditional Inference’. Journal of the Royal Statistical Society: Series B (Methodological) 49 (1): 1–18. https://doi.org/10.1111/j.2517-6161.1987.tb01422.x.
Efron, B. 1979. ‘Bootstrap Methods: Another Look at the Jackknife’. The Annals of Statistics 7 (1): 1–26. https://doi.org/10.1214/aos/1176344552.
Erdmann-Pham, Dan D., Jonathan Fischer, Justin Hong, and Yun S. Song. 2021. ‘Likelihood-Based Deconvolution of Bulk Gene Expression Data Using Single-Cell References’. Genome Research 31 (10): 1794–806. https://doi.org/10.1101/gr.272344.120.
Firth, David. 1993. ‘Bias Reduction of Maximum Likelihood Estimates’. Biometrika 80 (1): 27–38. https://doi.org/10.1093/biomet/80.1.27.
Jørgensen, Bent. 1987. ‘Small Dispersion Asymptotics’. Brazilian Journal of Probability and Statistics 1 (1): 59–90.
Malago, Luigi, and Giovanni Pistone. 2015. ‘Information Geometry of the Gaussian Distribution in View of Stochastic Optimization’. In Proceedings of the 2015 ACM Conference on Foundations of Genetic Algorithms XIII. Association for Computing Machinery. https://doi.org/10.1145/2725494.2725510.
Meng, Guanqun, Yue Pan, Wen Tang, et al. 2024. ‘Imply: Improving Cell-Type Deconvolution Accuracy Using Personalized Reference Profiles’. Genome Medicine 16 (1): 65. https://doi.org/10.1186/s13073-024-01338-z.
Newman, Aaron, Chih Liu, Michael Green, et al. 2015. ‘Robust Enumeration of Cell Subsets from Tissue Expression Profiles’. Nature Methods 12. https://doi.org/10.1038/nmeth.3337.
Nguyen, Ha, Khoi Nguyen, Phi Bya, Tarik Alafif, Tho T Quan, and Tin Nguyen. 2026. ‘DeOPUS: Cellular Deconvolution via Optimized Power-Transformed Unmixing with Shrinkage’. Briefings in Bioinformatics 27 (5): bbag524. https://doi.org/10.1093/bib/bbag524.
Nguyen, Hung, Ha Nguyen, Duc Tran, Sorin Draghici, and Tin Nguyen. 2024. ‘Fourteen Years of Cellular Deconvolution: Methodology, Applications, Technical Evaluation and Outstanding Challenges’. Nucleic Acids Research 52 (9): 4761–83. https://doi.org/10.1093/nar/gkae267.
Oehlert, Gary W. 1992. ‘A Note on the Delta Method’. The American Statistician 46 (1): 27–29. https://doi.org/10.1080/00031305.1992.10475842.
Philipps, Viviane, Boris P. Hejblum, Mélanie Prague, Daniel Commenges, and Cécile Proust-Lima. 2021. ‘Robust and Efficient Optimization Using a Marquardt-Levenberg Algorithm with R Package marqLevAlg’. The R Journal 13. https://doi.org/10.32614/rj-2021-089.
Philipps, Viviane, Cecile Proust-Lima, Melanie Prague, Boris Hejblum, Daniel Commenges, and Amadou Diakite. 2023. marqLevAlg: A Parallelized General-Purpose Optimization Based on Marquardt-Levenberg Algorithm.
Roch, Sebastien. 2024. Modern Discrete Probability: An Essential Toolkit. 1st edn. Cambridge University Press. https://doi.org/10.1017/9781009305129.
Self, Steven G., and Kung-Yee Liang. 1987. ‘Asymptotic Properties of Maximum Likelihood Estimators and Likelihood Ratio Tests Under Nonstandard Conditions’. Journal of the American Statistical Association 82 (398): 605–10. https://doi.org/10.1080/01621459.1987.10478472.
Sturm, Gregor, Francesca Finotello, Florent Petitprez, et al. 2019. ‘Comprehensive Evaluation of Transcriptome-Based Cell-Type Quantification Methods for Immuno-Oncology’. Bioinformatics (Oxford, England) 35. https://doi.org/10.1093/bioinformatics/btz363.
Vaart, A. W. van der. 2000. Asymptotic Statistics. Cambridge University Press.
Vellame, Dorothea Seiler, Gemma Shireby, Ailsa MacCalman, et al. 2023. ‘Uncertainty Quantification of Reference-Based Cellular Deconvolution Algorithms’. Epigenetics 18. https://doi.org/10.1080/15592294.2022.2137659.
Wilks, S. S. 1938. ‘The Large-Sample Distribution of the Likelihood Ratio for Testing Composite Hypotheses’. The Annals of Mathematical Statistics 9 (1): 60–62. https://doi.org/10.1214/aoms/1177732360.
Wilson, Edwin B. 1927. ‘Probable Inference, the Law of Succession, and Statistical Inference’. Journal of the American Statistical Association 22 (158): 209–12. https://doi.org/10.2307/2276774.
Xie, Dongyue, Lin Gui, and Jingshu Wang. 2026. ‘Statistical Inference for Cell Type Deconvolution’. Journal of the Royal Statistical Society Series B: Statistical Methodology 88 (4): 1449–68. https://doi.org/10.1093/jrsssb/qkag054.
Yee, Thomas William. 2022. ‘On the Hauck-Donner Effect in Wald Tests: Detection, Tipping Points, and Parameter Space Characterization’. Journal of the American Statistical Association 117 (540): 1763–74. https://doi.org/10.1080/01621459.2021.1886936.
Zhao, Yifan, Brian E Vestal, and Camille M Moore. 2026. ‘Evaluating Reference-Mixture Matching in Cell-Type Deconvolution with Single-Cell RNA-seq References’. Briefings in Bioinformatics 27 (2): bbag184. https://doi.org/10.1093/bib/bbag184.