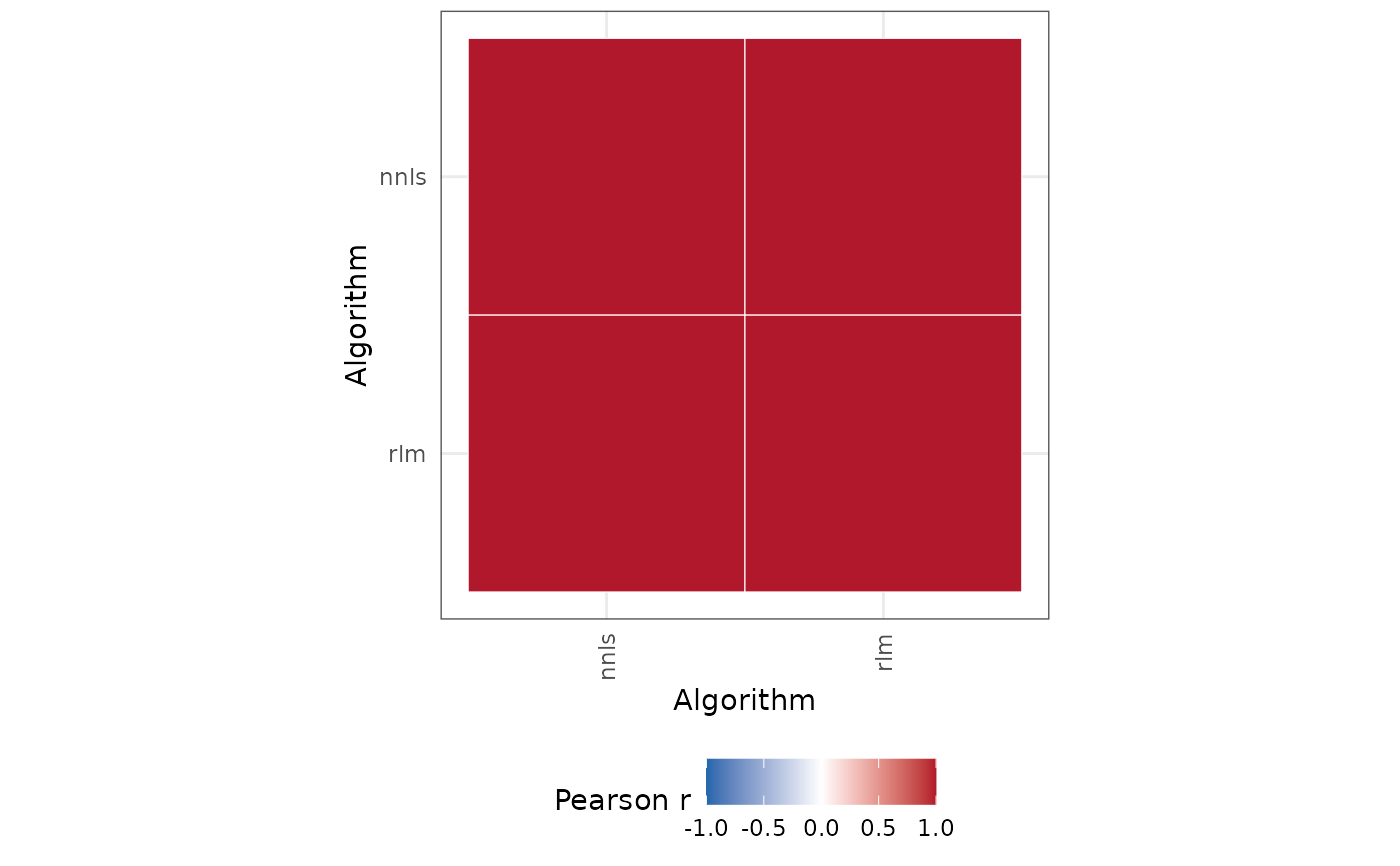
Tile heatmap of algorithm-similarity correlations
Source:R/04_02_benchmark_visualisation.R
plot_algorithm_similarity.Rdggplot2::geom_tile() display of algorithm_similarity(), with
rows and columns ordered by Ward D2 clustering of
\(1-r\). Optional dendrogram via ggdendro (Suggests), drawn to
the right of the tiles with leaves flush against the heatmap
and Ward merge heights on the axis.
This is the default for a small correlation matrix;
plot_correlation_Heatmap() is reserved for linked multi-omics grids.
Usage
plot_algorithm_similarity(
  benchmark,
  facet_rows = NULL,
  facet_cols = NULL,
  dendrogram = FALSE
)
Arguments
- benchmark
List from
run_simulation_benchmark().- facet_rows, facet_cols
Optional scenario columns. When supplied, correlations are computed inside each facet cell.
- dendrogram
If
TRUE, attach aggdendroggplot to the right of the tiles as attribute"dendrogram"(ignored when scenario facets are used).
Examples
set.seed(1)
genes <- paste0("g", 1:2)
cts <- paste0("ct", 1:2)
mu <- matrix(c(20, 22, 22, 20), nrow = 2, dimnames = list(genes, cts))
Sigma <- array(
  c(1, 0, 0, 1, 1, 0, 0, 1),
  dim = c(2, 2, 2),
  dimnames = list(genes, genes, cts)
)
out <- run_simulation_benchmark(
  tibble::tibble(
    true_theta = list(list(p = c(0.5, 0.5), mu = mu, sigma = Sigma))
  ),
  deconvolution_functions = list(
    "nnls" = list(FUN = deconvolute_ratios_nnls),
    "rlm" = list(FUN = deconvolute_ratios_rlm)
  ),
  n = 4,
  cores = 1
)
if (requireNamespace("ggplot2", quietly = TRUE)) {
  plot_algorithm_similarity(out)
}